Sales room impact reports and dashboard
This article will guide you through setting up 7 recommended HubSpot reports so you can understand the impact of your Arrows Sales Rooms.
These 7 HubSpot reports will help you get a sense of the impact your Arrows sales rooms are having on your sales process.
Set them up and add them to a dashboard so you can understand how your rooms impact your deals, plus use the information to optimize your process!
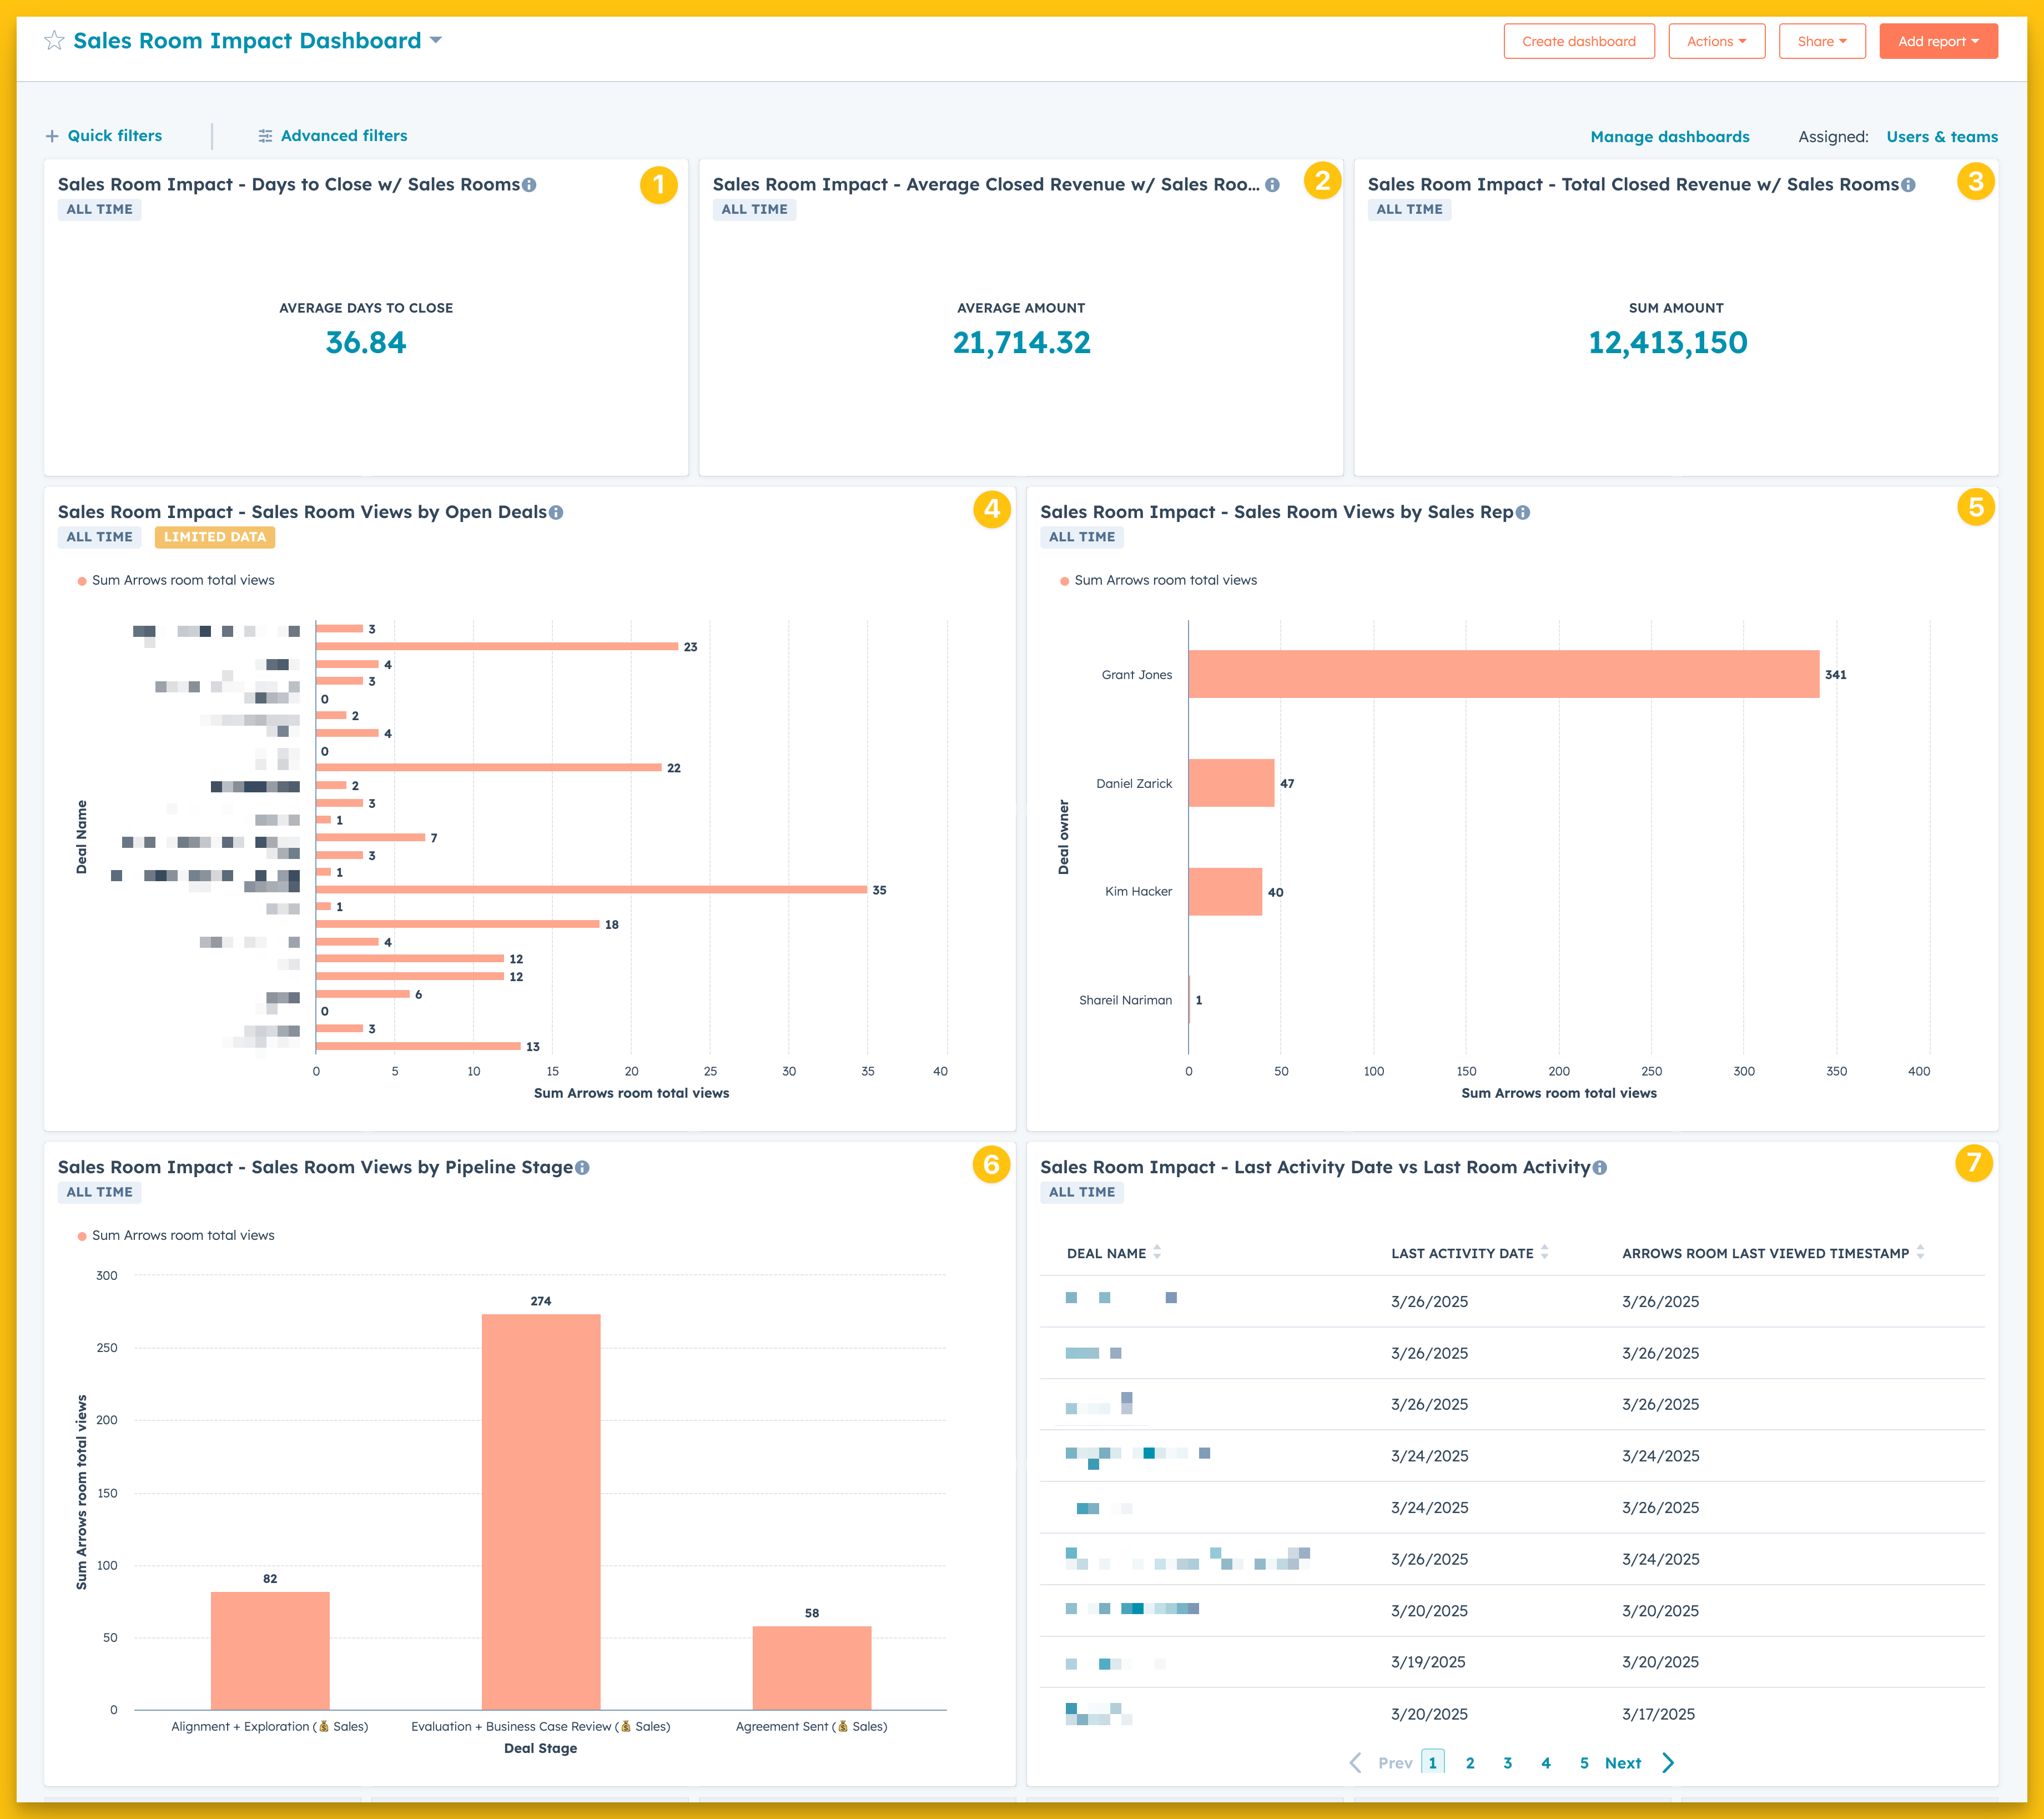
Start by creating a dashboard.
Then create and add each report to your dashboard so it looks something like this:
The following reports are contingent on these data points synced from Arrows into HubSpot, they will appear as these properties on your HubSpot record used for sales rooms…
Arrows room URL
Arrows room total views
Arrows room last viewed timestamp
NOTE: most commonly this is the deal record/object in HubSpot. We will use the deal record in the following examples but you can use the record of your choice.
An Arrows admin will need to sync the data here - https://app.arrows.to/settings/hubspot/synced_room_properties
When syncing the data points, they’ll be labeled respectively as…
URL
Total opens
Last opened
Report types
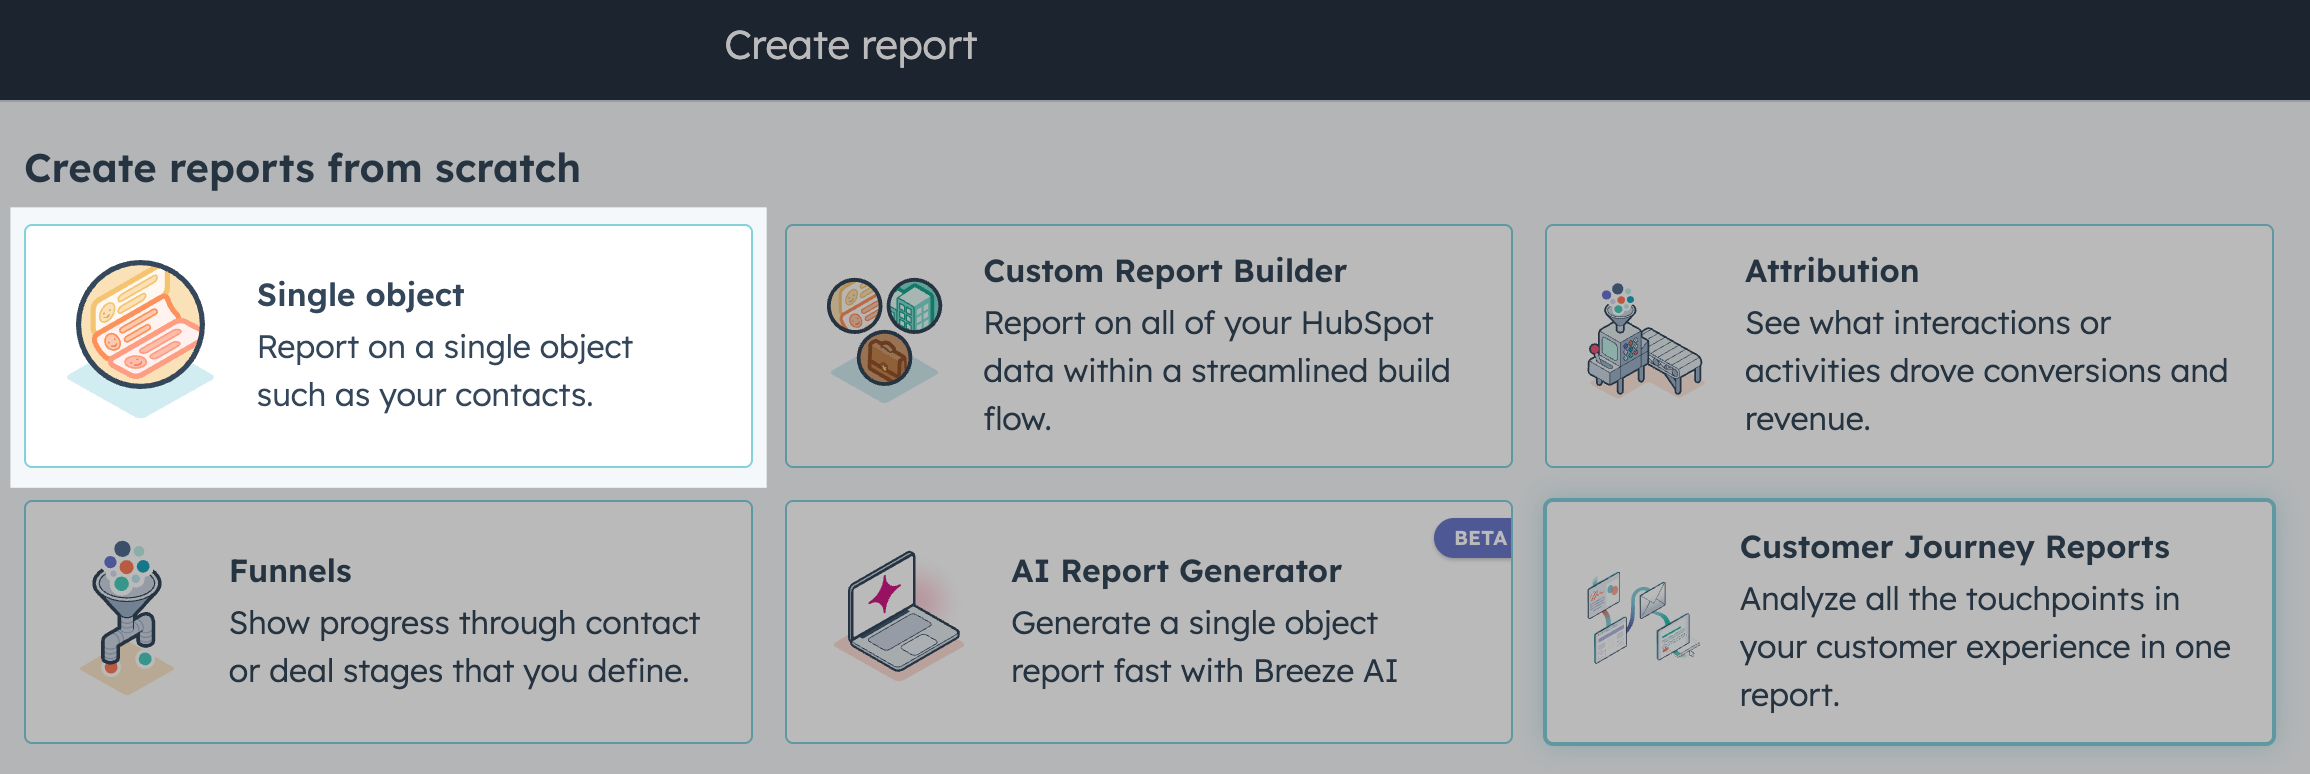
All 7 of these report types are custom reports created from scratch in HubSpot. For each report below, you’ll need to create a new report with these conditions…
The report type will be Single object:
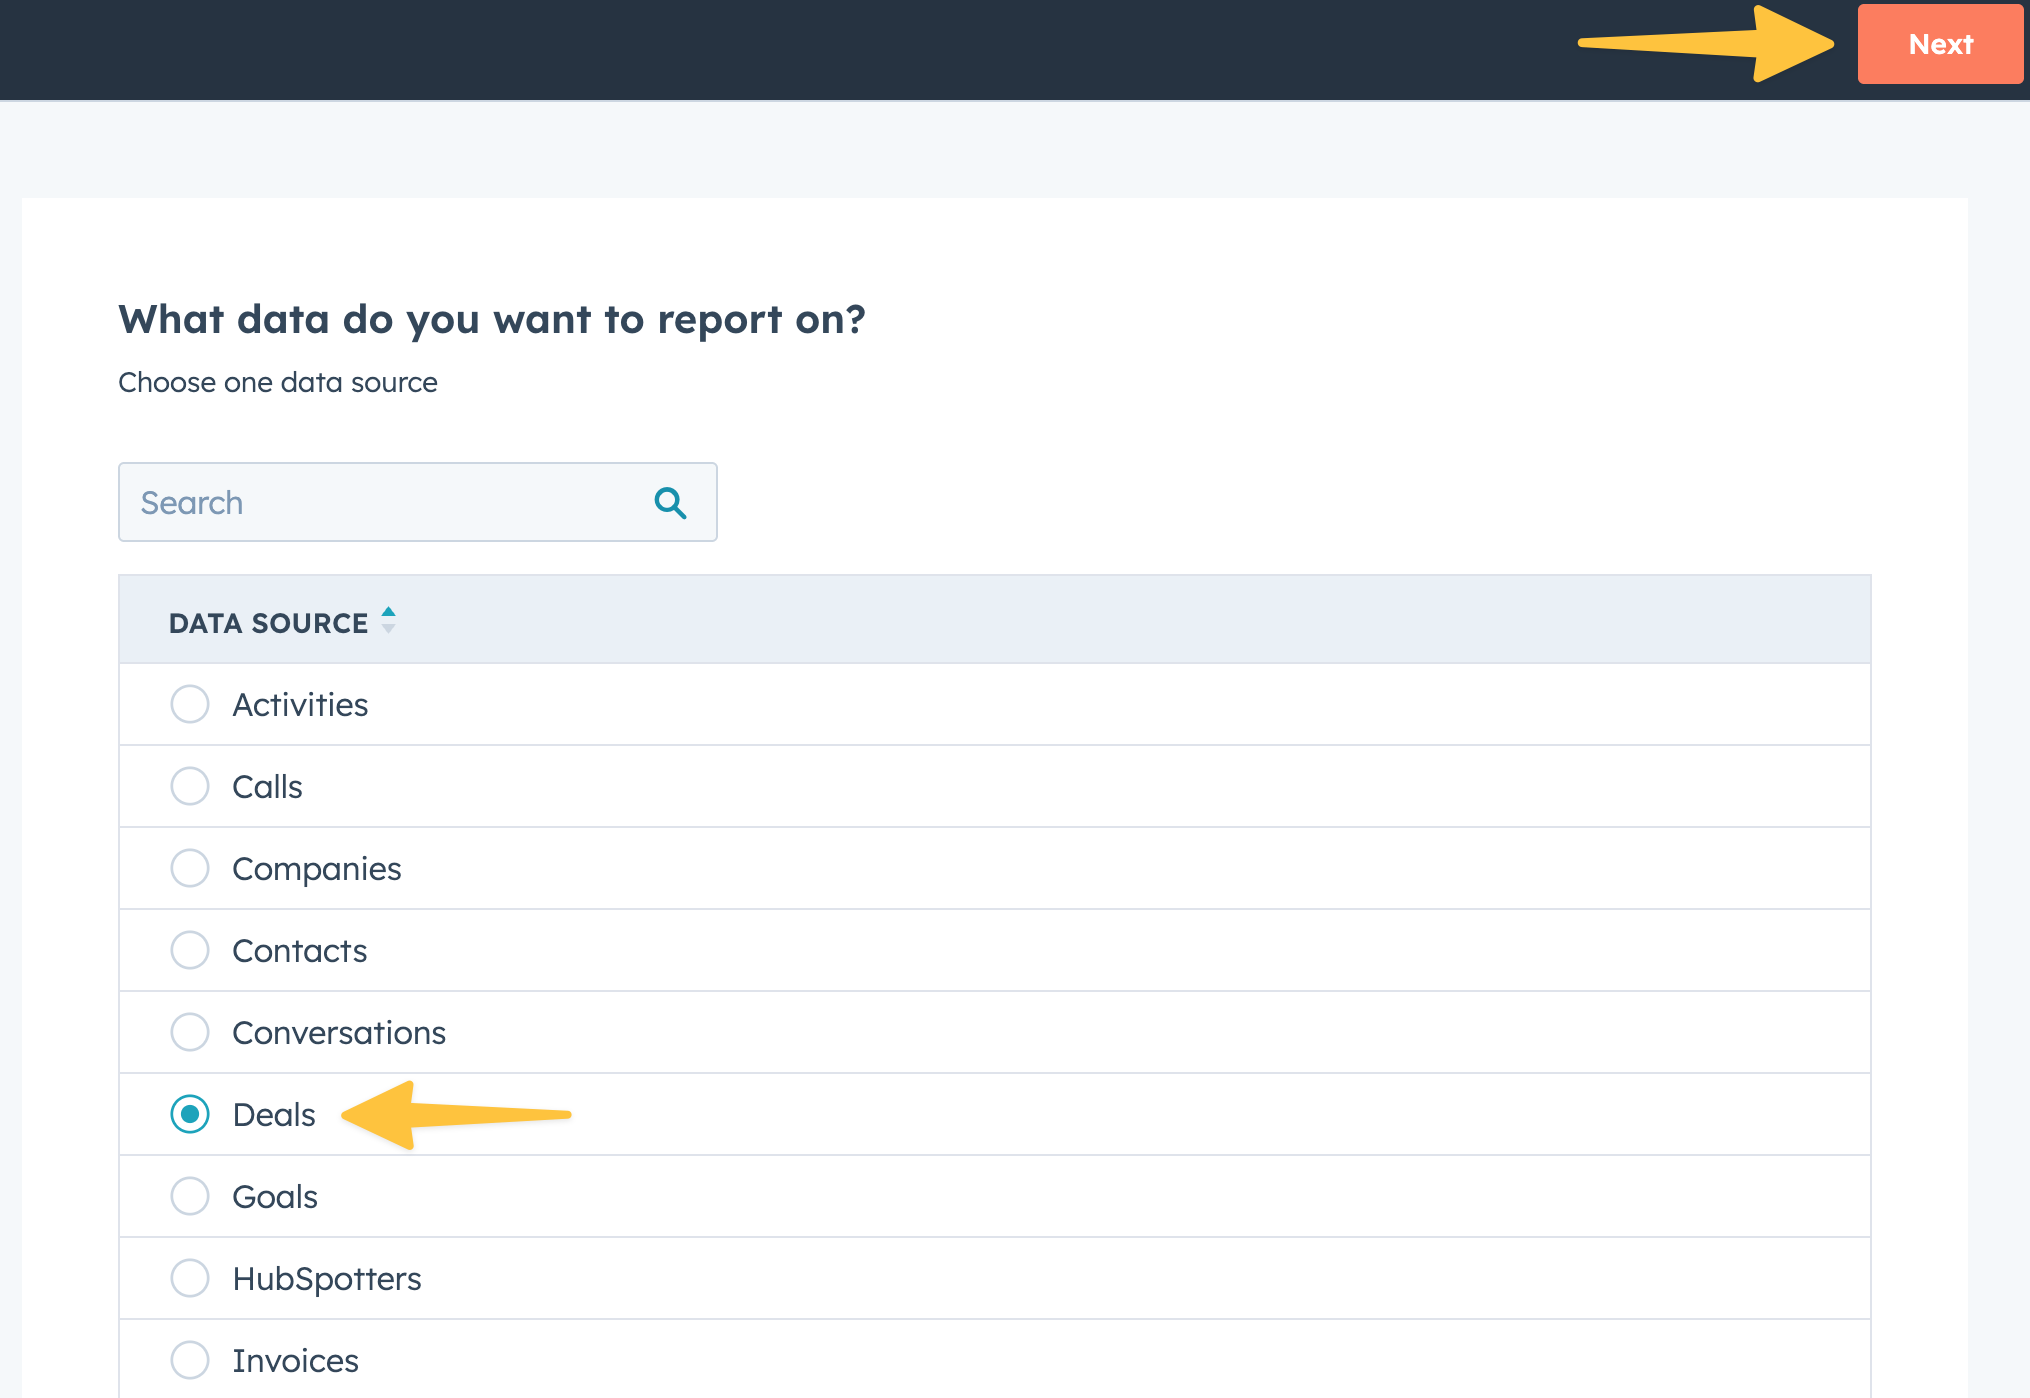
And the data source for each report type will be Deals:
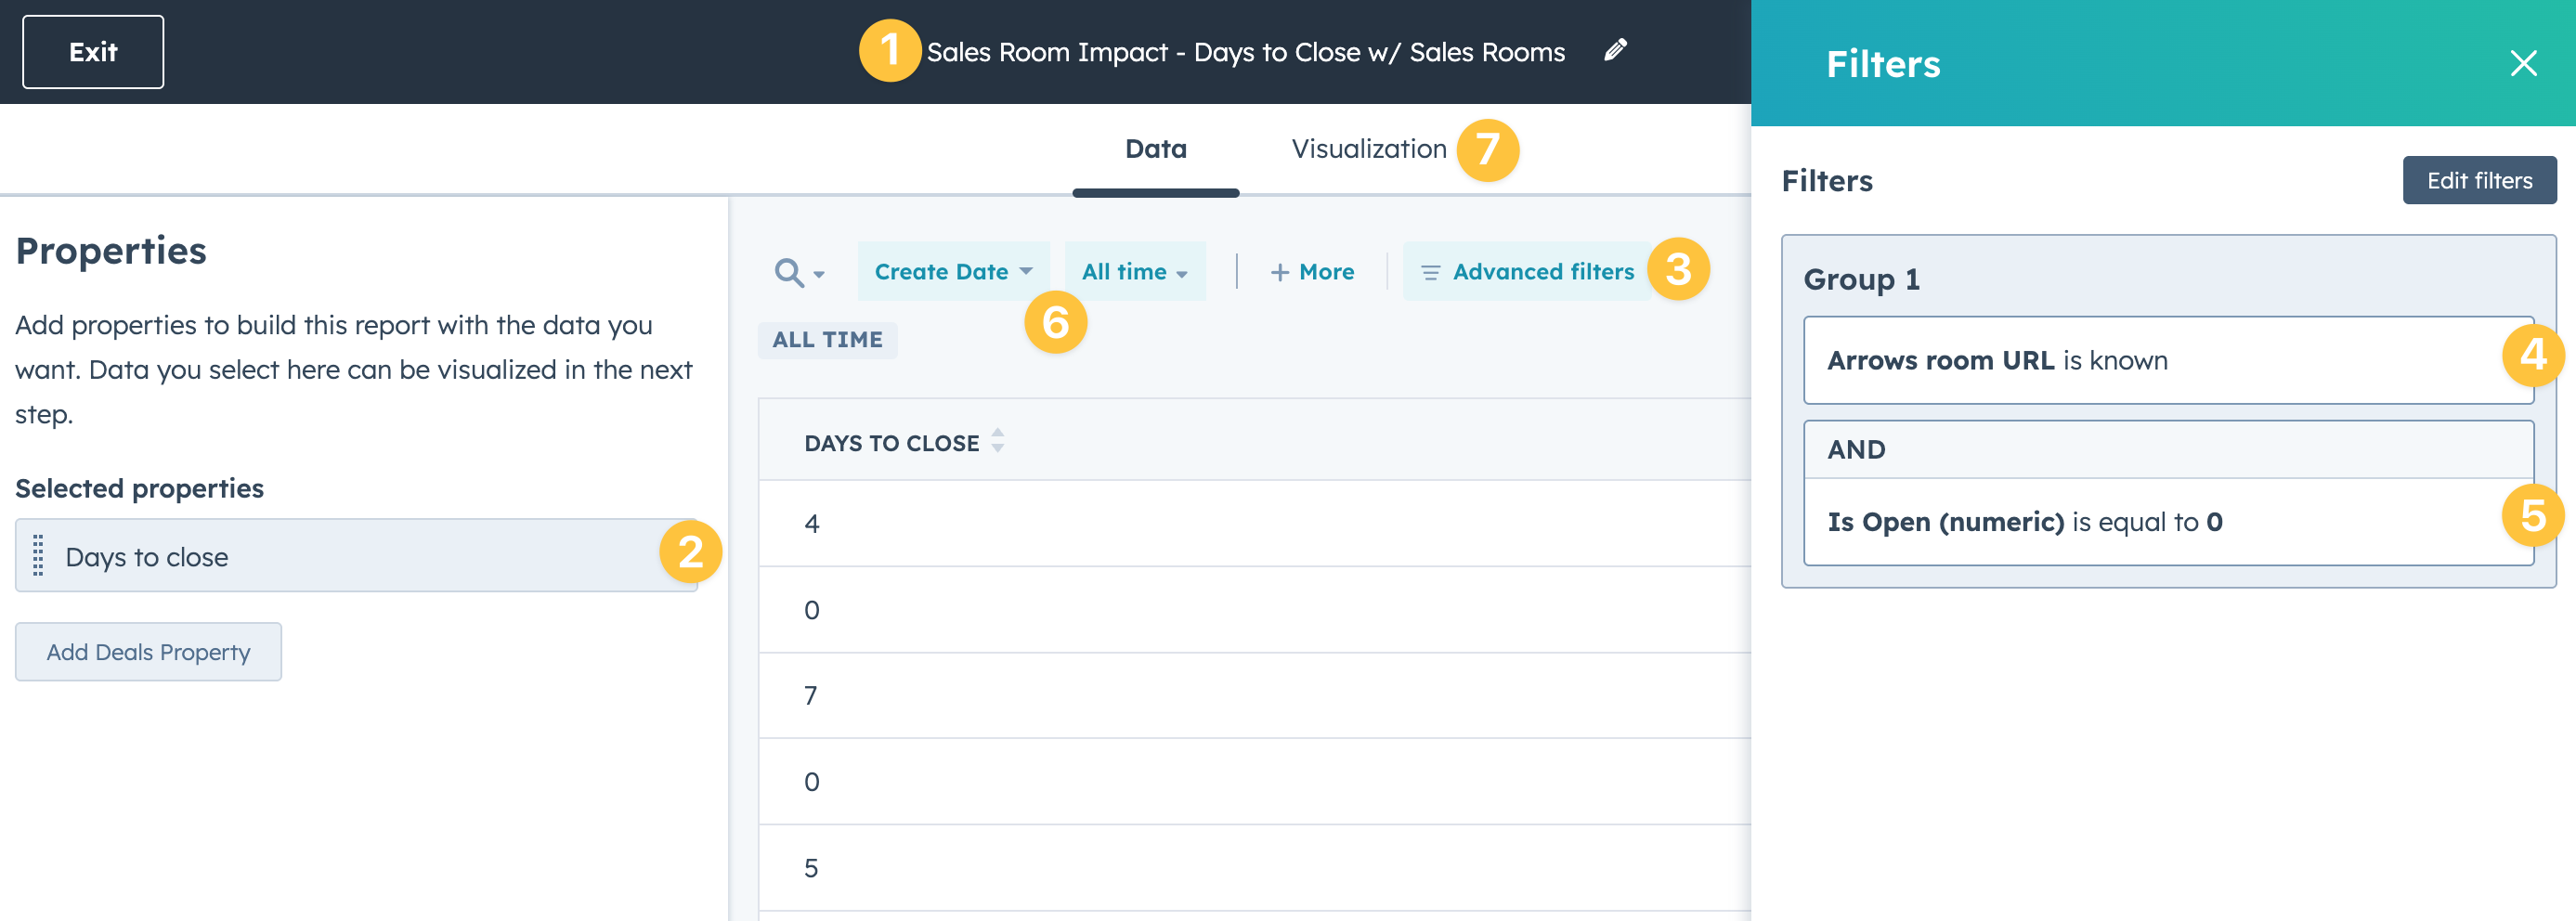
Report 1 - Days to Close w/ Sales Rooms
This report will help you understand the average days to close for deals with an attached Arrows room.
After you create the report, start by…
naming your report
Add Days to close as a property
Select advanced filters
Add a filter for Arrows room URL is known
Add a filter for Is Open is equal to “0”
Adjust your time range
Select Visualization to continue setup
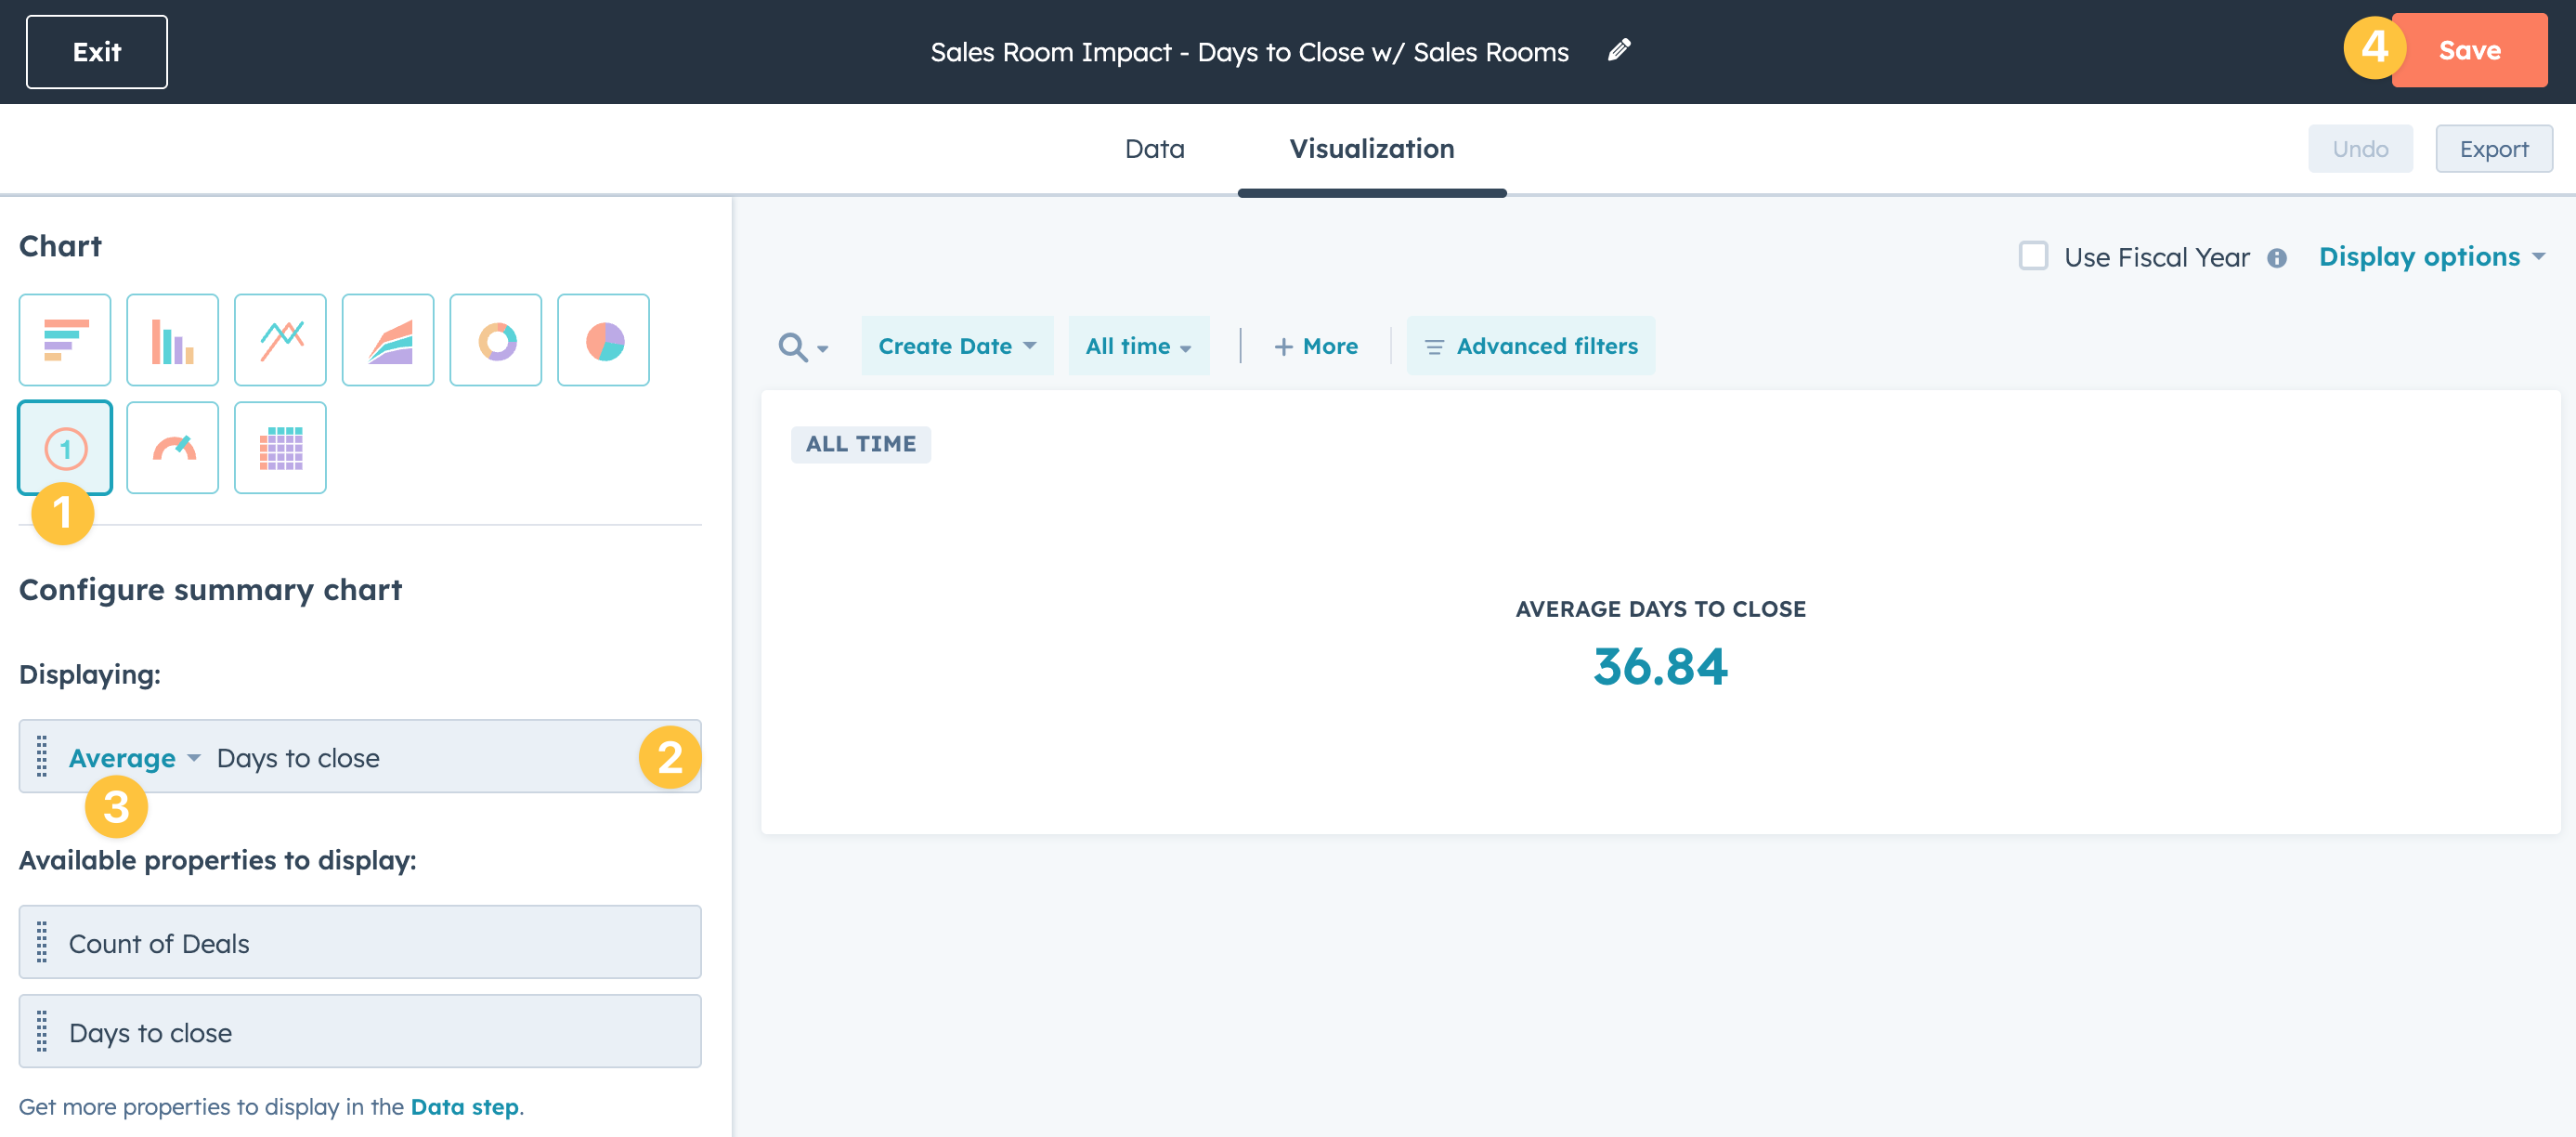
From the Visualization tab…
Select the Summary chart type
Add Days to close as the displaying property
Change the display type to Average
Save your report
When you save each report, you’ll get the option to add it directly to your newly created dashboard.
You can adjust the size of each report on the dashboard to make it appear how you’d like.
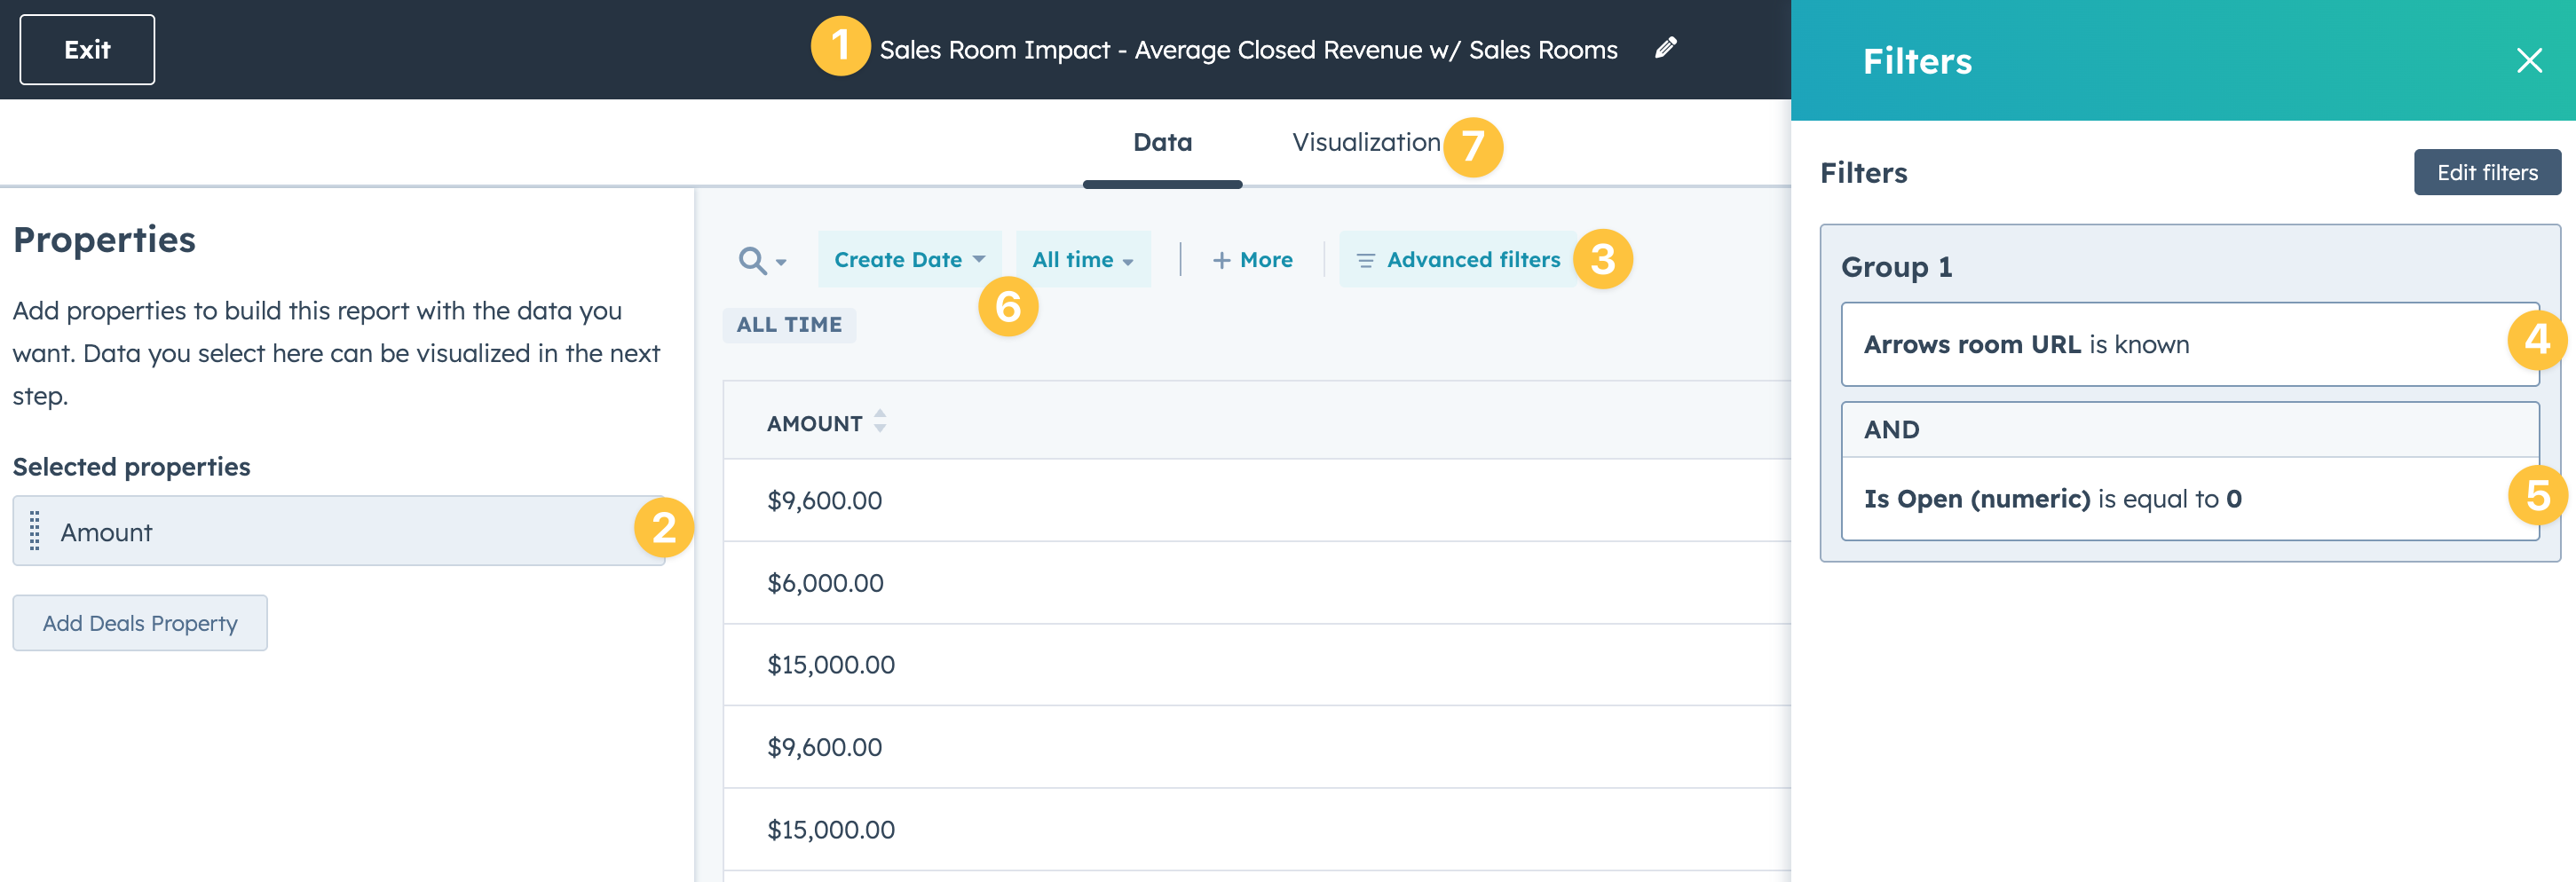
Report 2 - Average closed revenue w/ Sales rooms
This report will help you understand the average revenue from closed deals with an attached Arrows room.
After you create the report, start by…
naming your report
Add Amount as a property
Select advanced filters
Add a filter for Arrows room URL is known
Add a filter for Is Open is equal to “0”
Adjust your time range
Select Visualization to continue setup
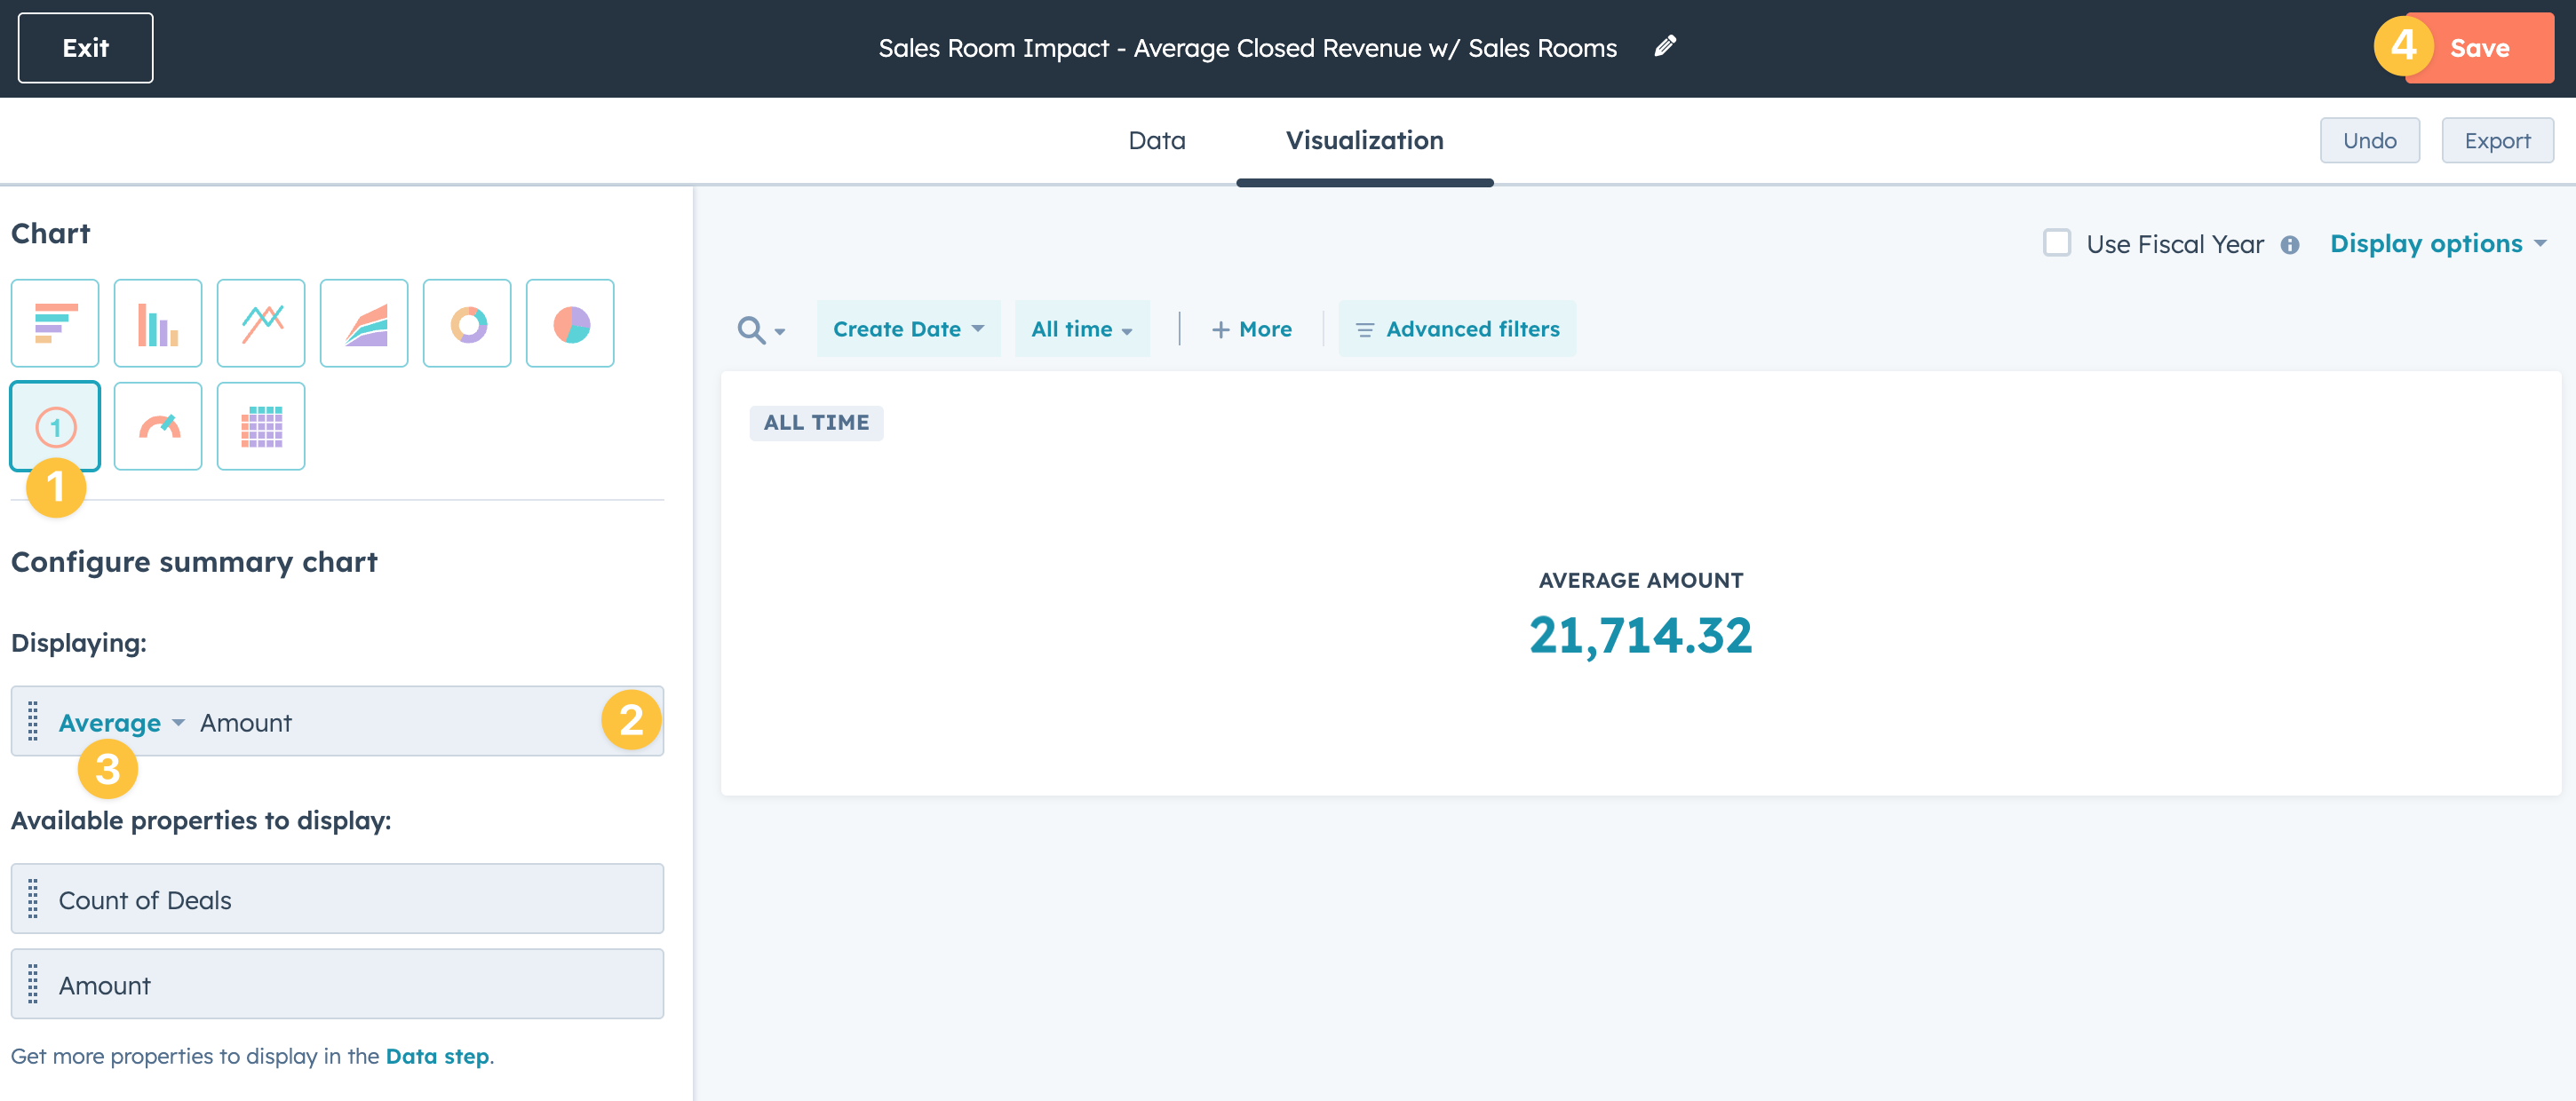
From the Visualization tab…
Select the Summary chart type
Add Amount as the displaying property
Change the display type to Average
Save your report and add it to your dashboard
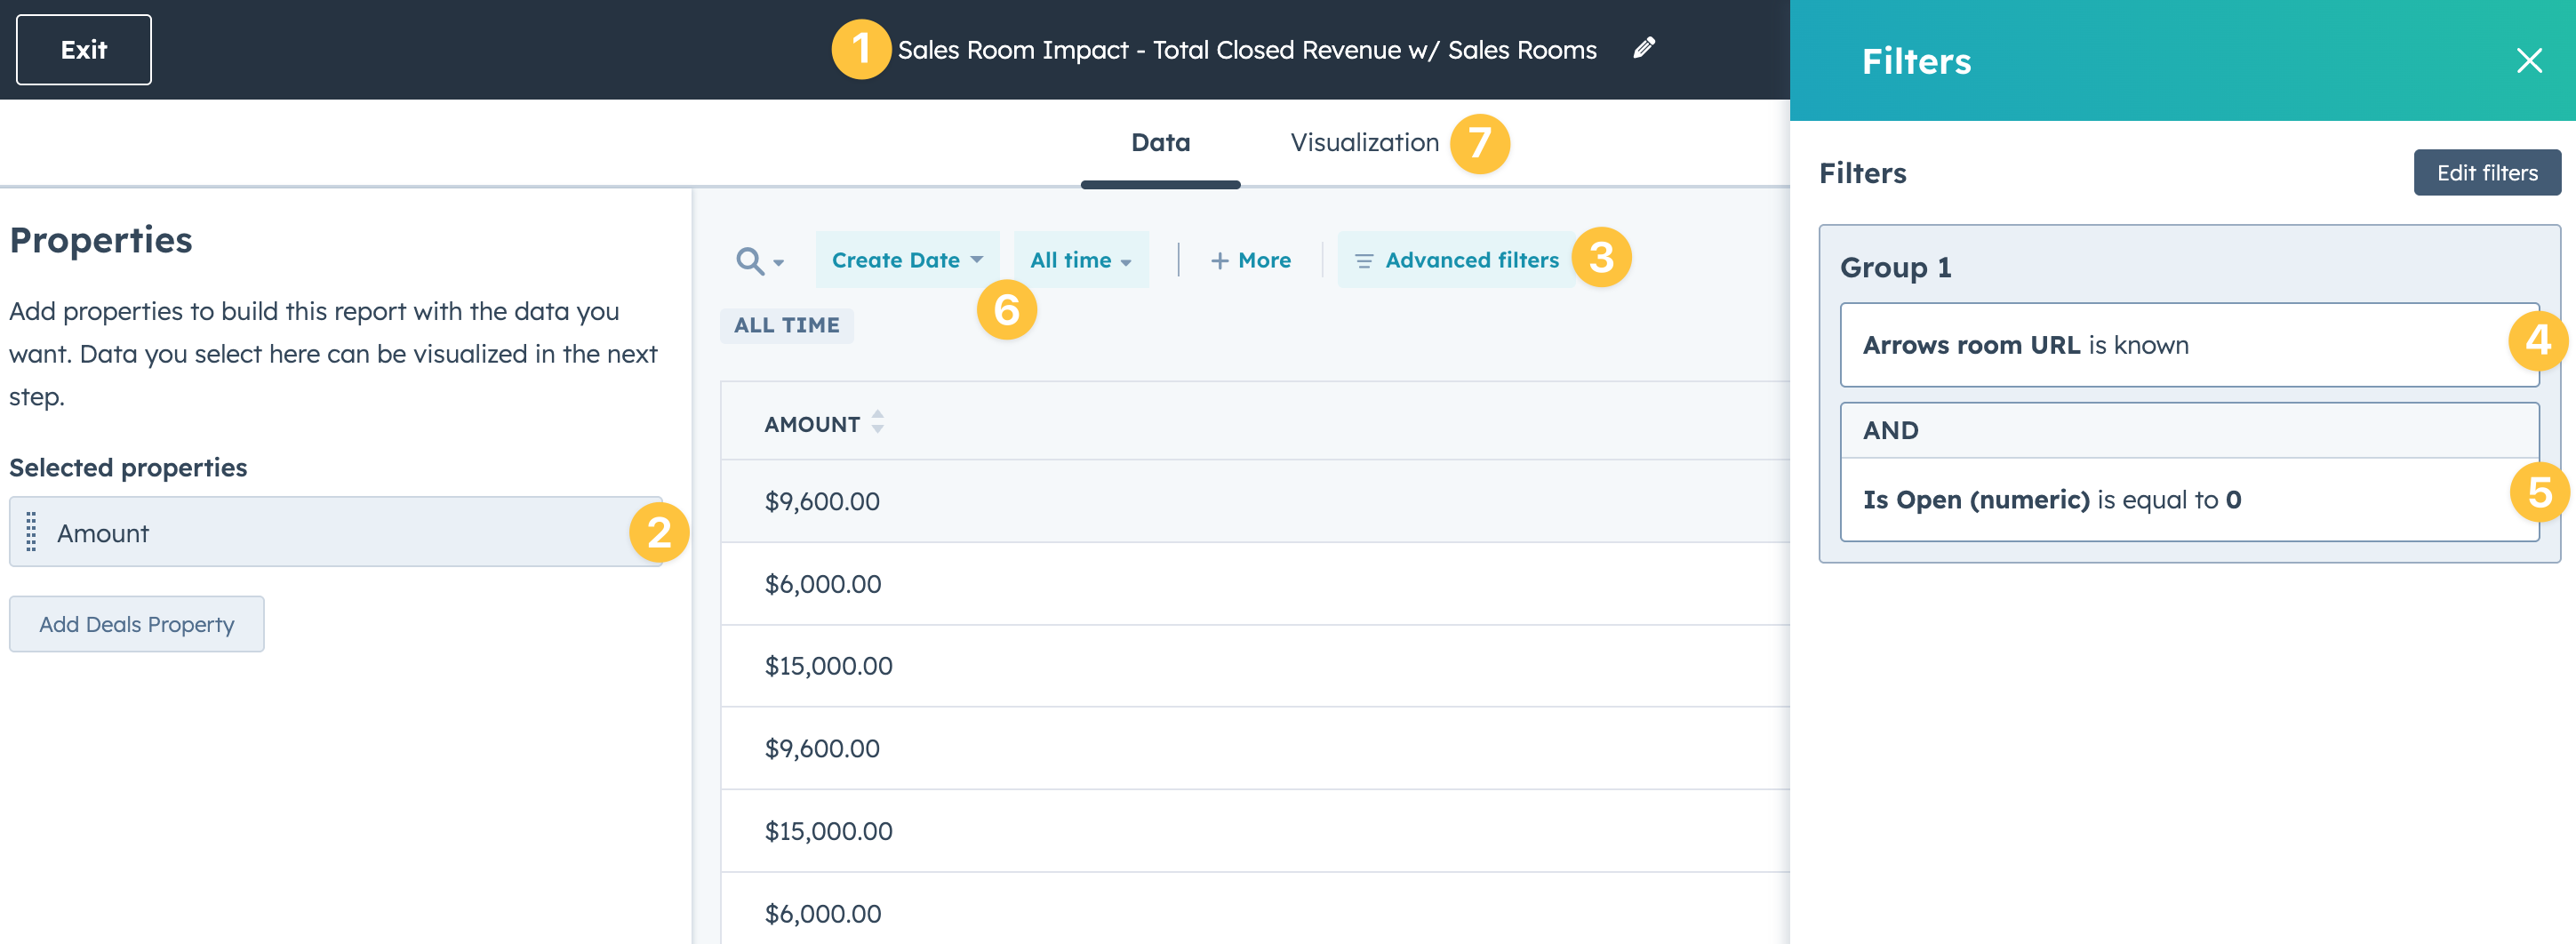
Report 3 - Total closed revenue w/ Sales rooms
This report will help you understand the total revenue from closed deals with an attached Arrows room.
After you create the report, start by…
naming your report
Add Amount as a property
Select advanced filters
Add a filter for Arrows room URL is known
Add a filter for Is Open is equal to “0”
Adjust your time range
Select Visualization to continue setup
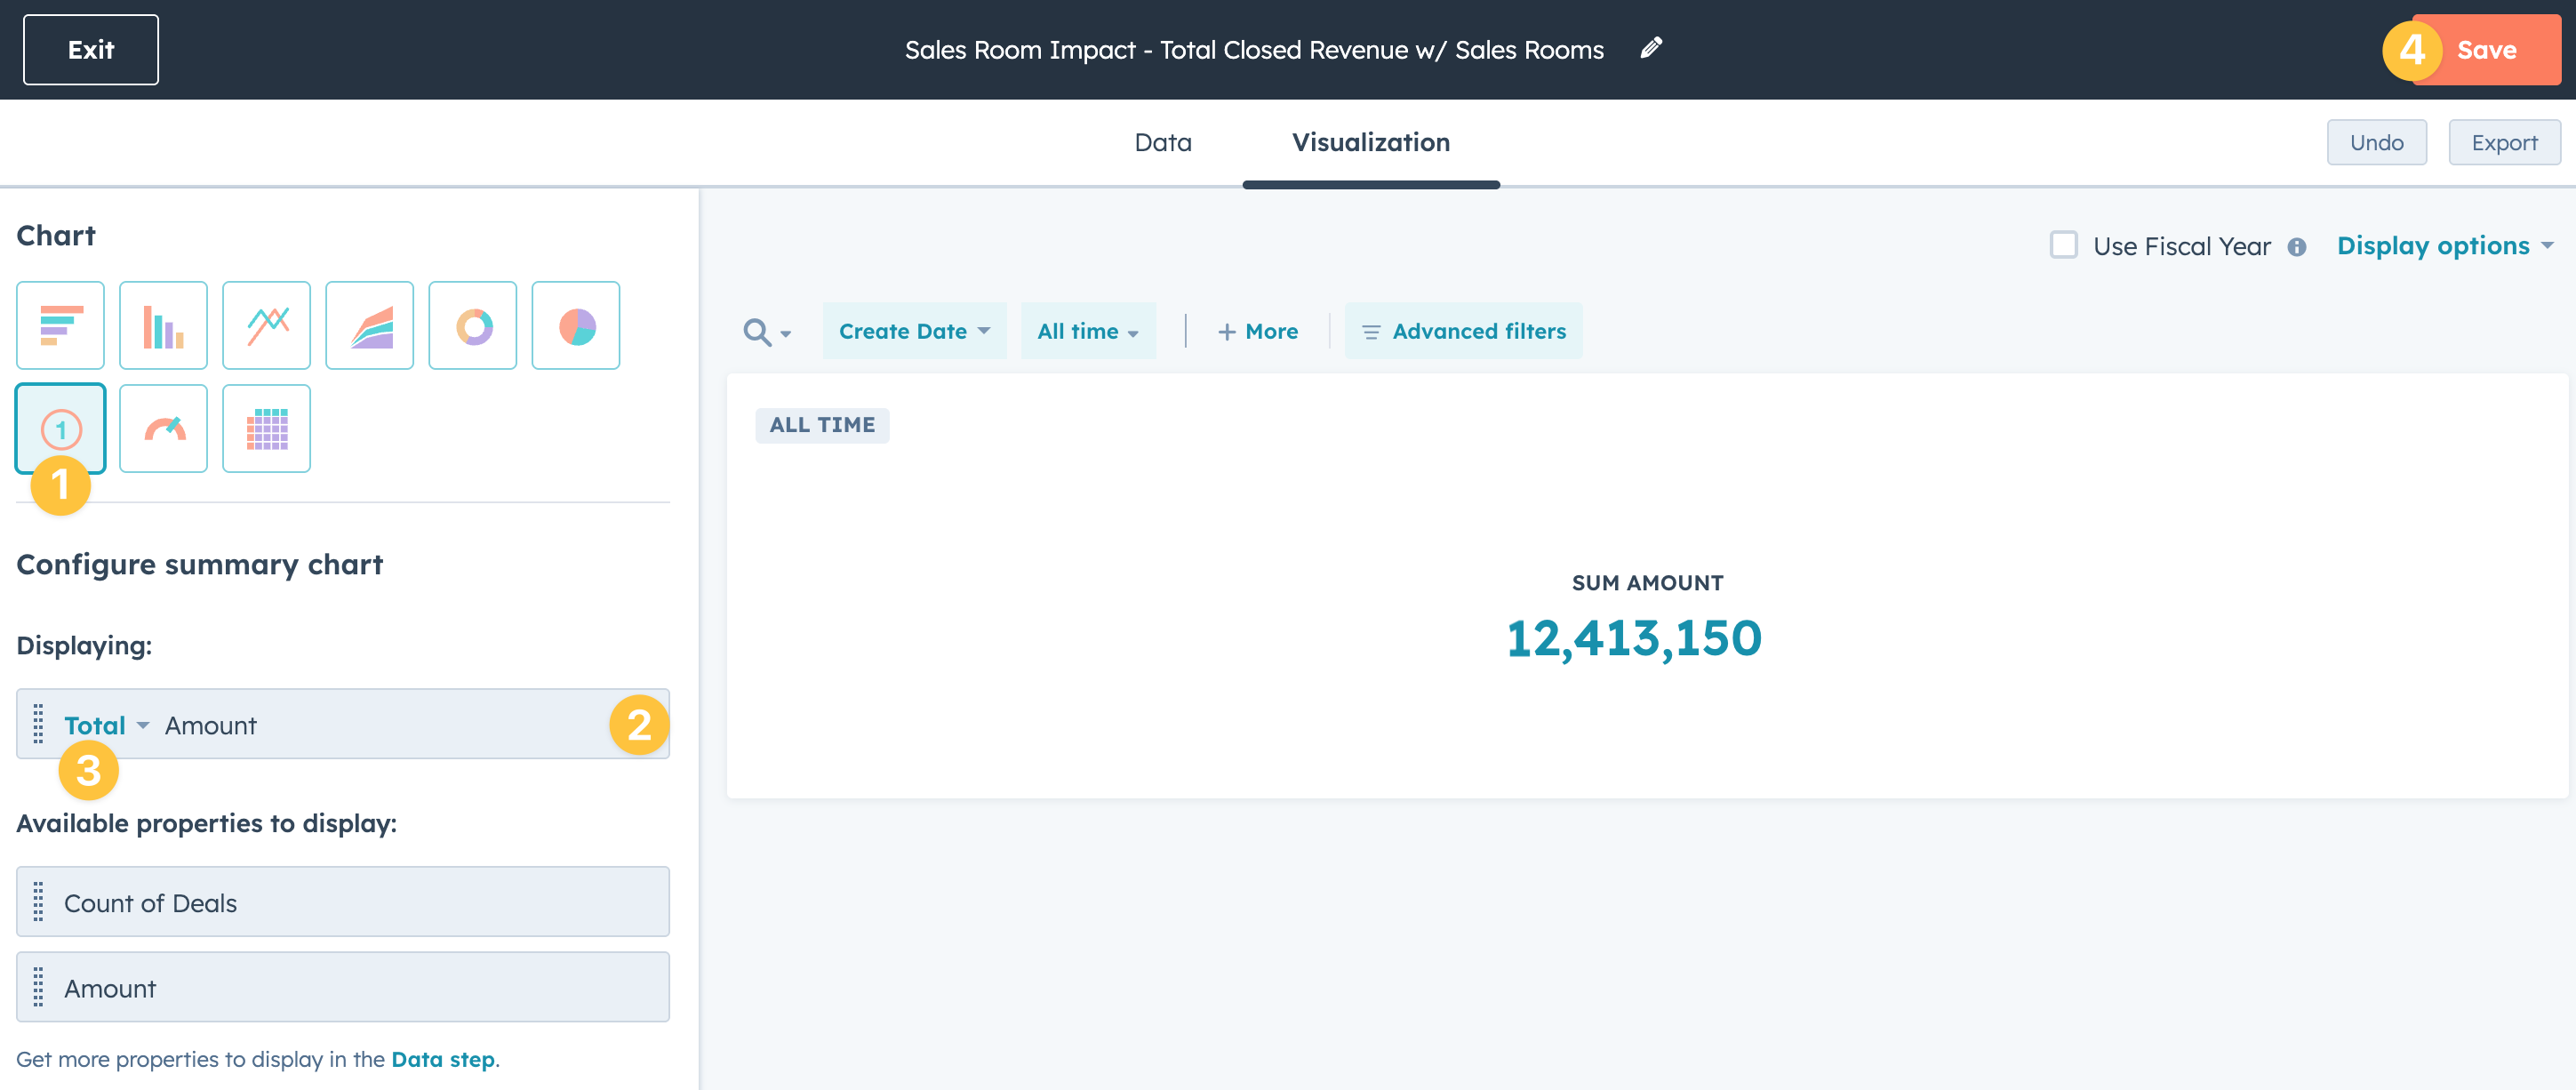
From the Visualization tab…
Select the Summary chart type
Add Amount as the displaying property
Change the display type to Total
Save your report and add it to your dashboard
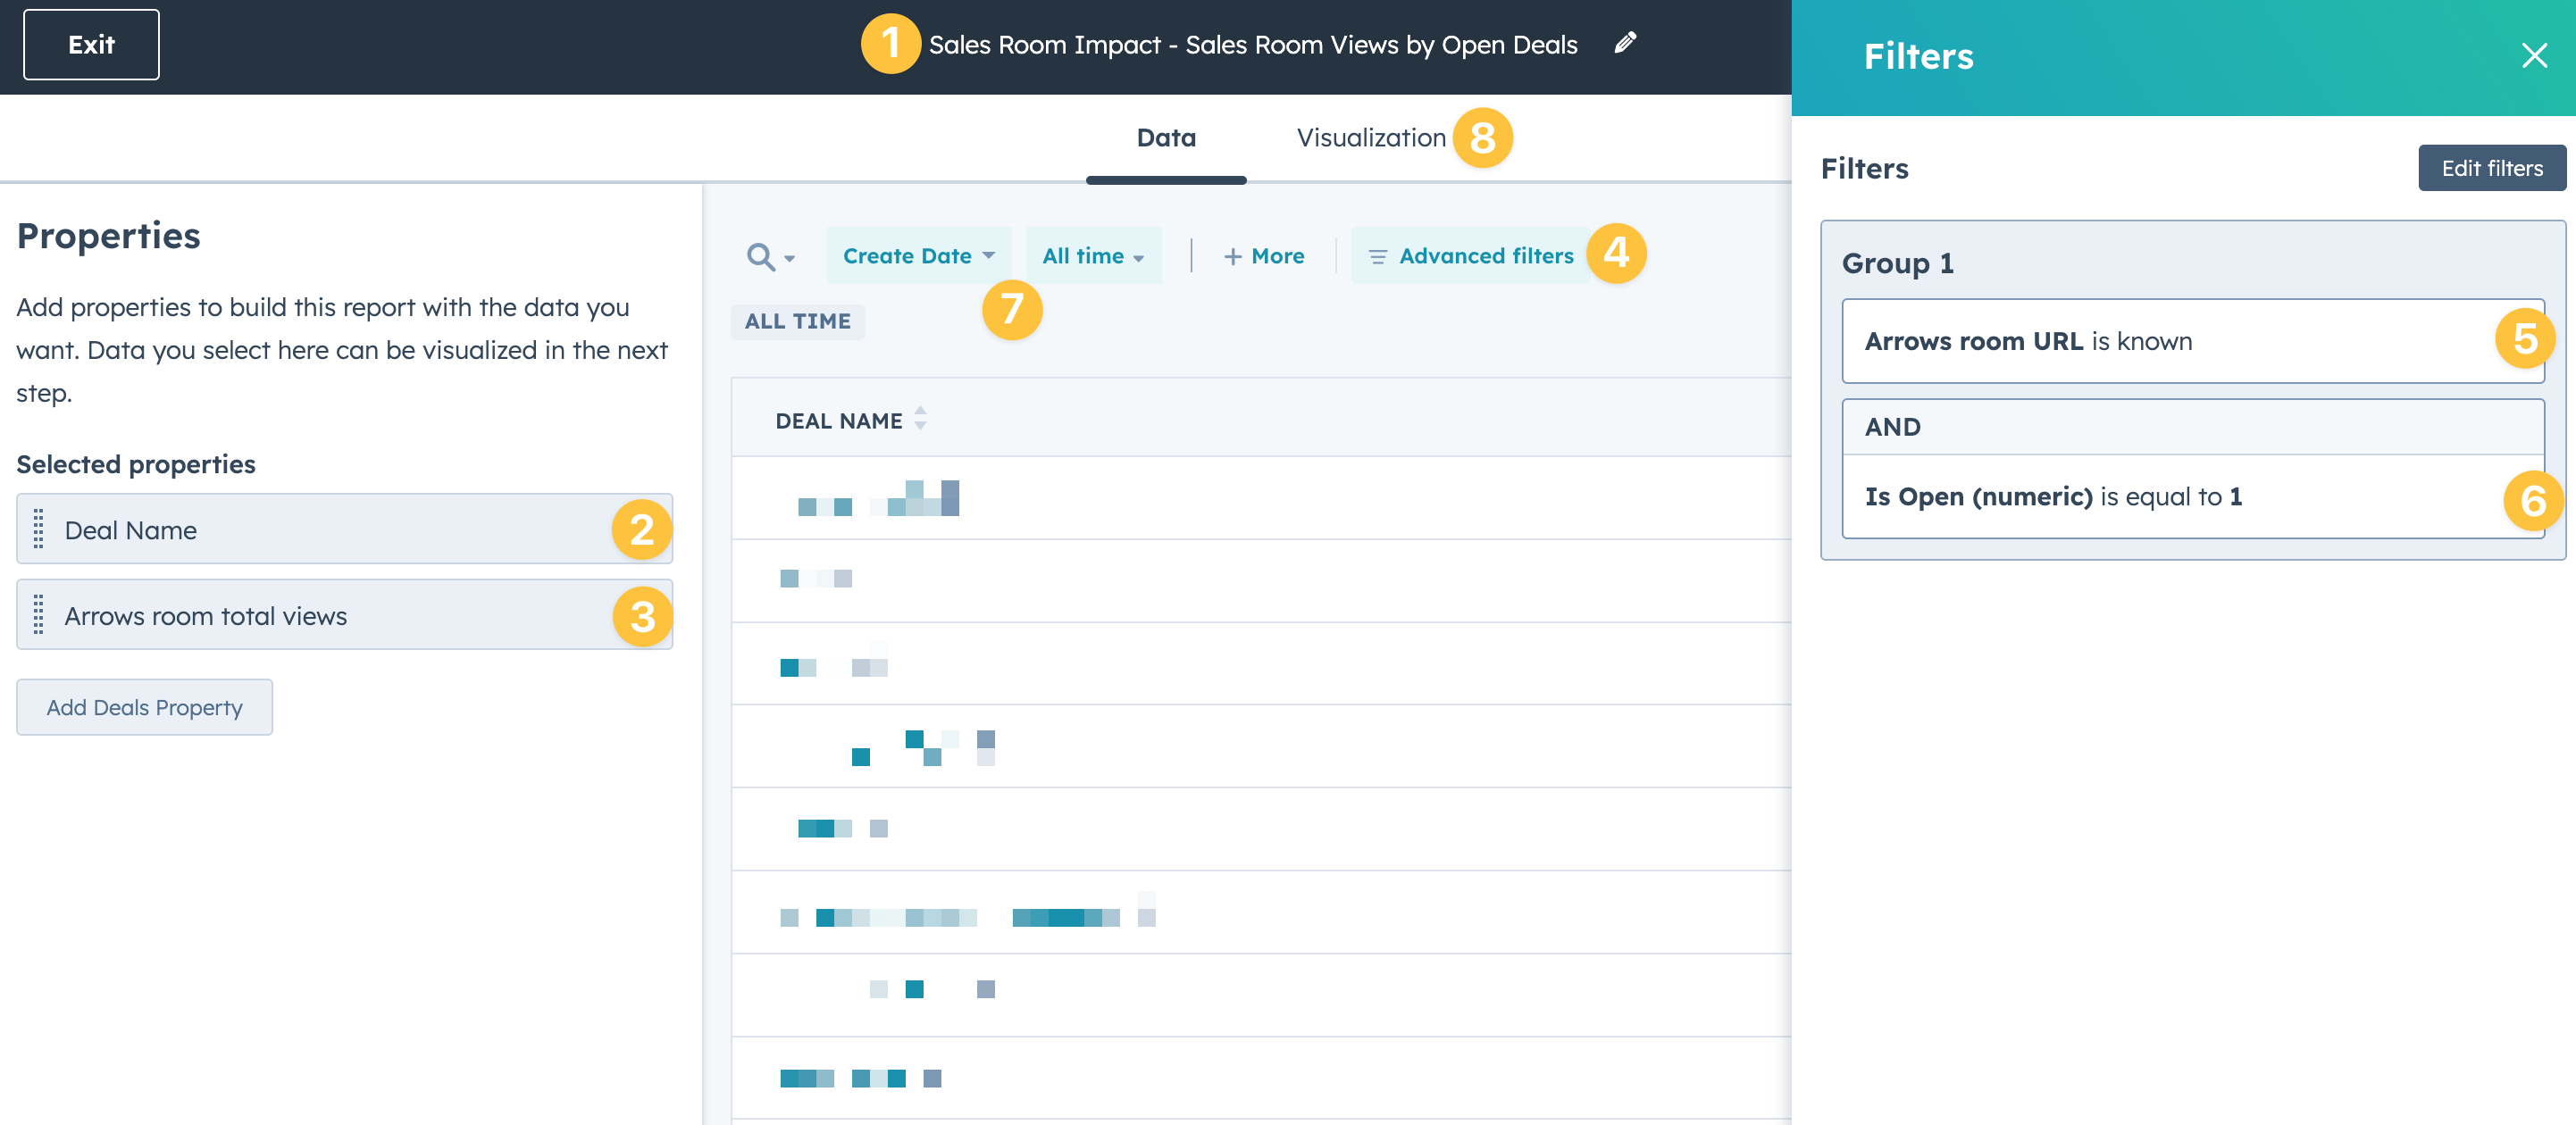
Report 4 - Sales rooms views by open deals
This report will help you understand the number of total views for each room based on each deal with an attached Arrows room.
After you create the report, start by…
naming your report
Add Deal Name as a property (blurred out in this example)
Add Arrows room total views as a property
Select advanced filters
Add a filter for Arrows room URL is known
Add a filter for Is Open is equal to “1”
Adjust your time range
Select Visualization to continue setup
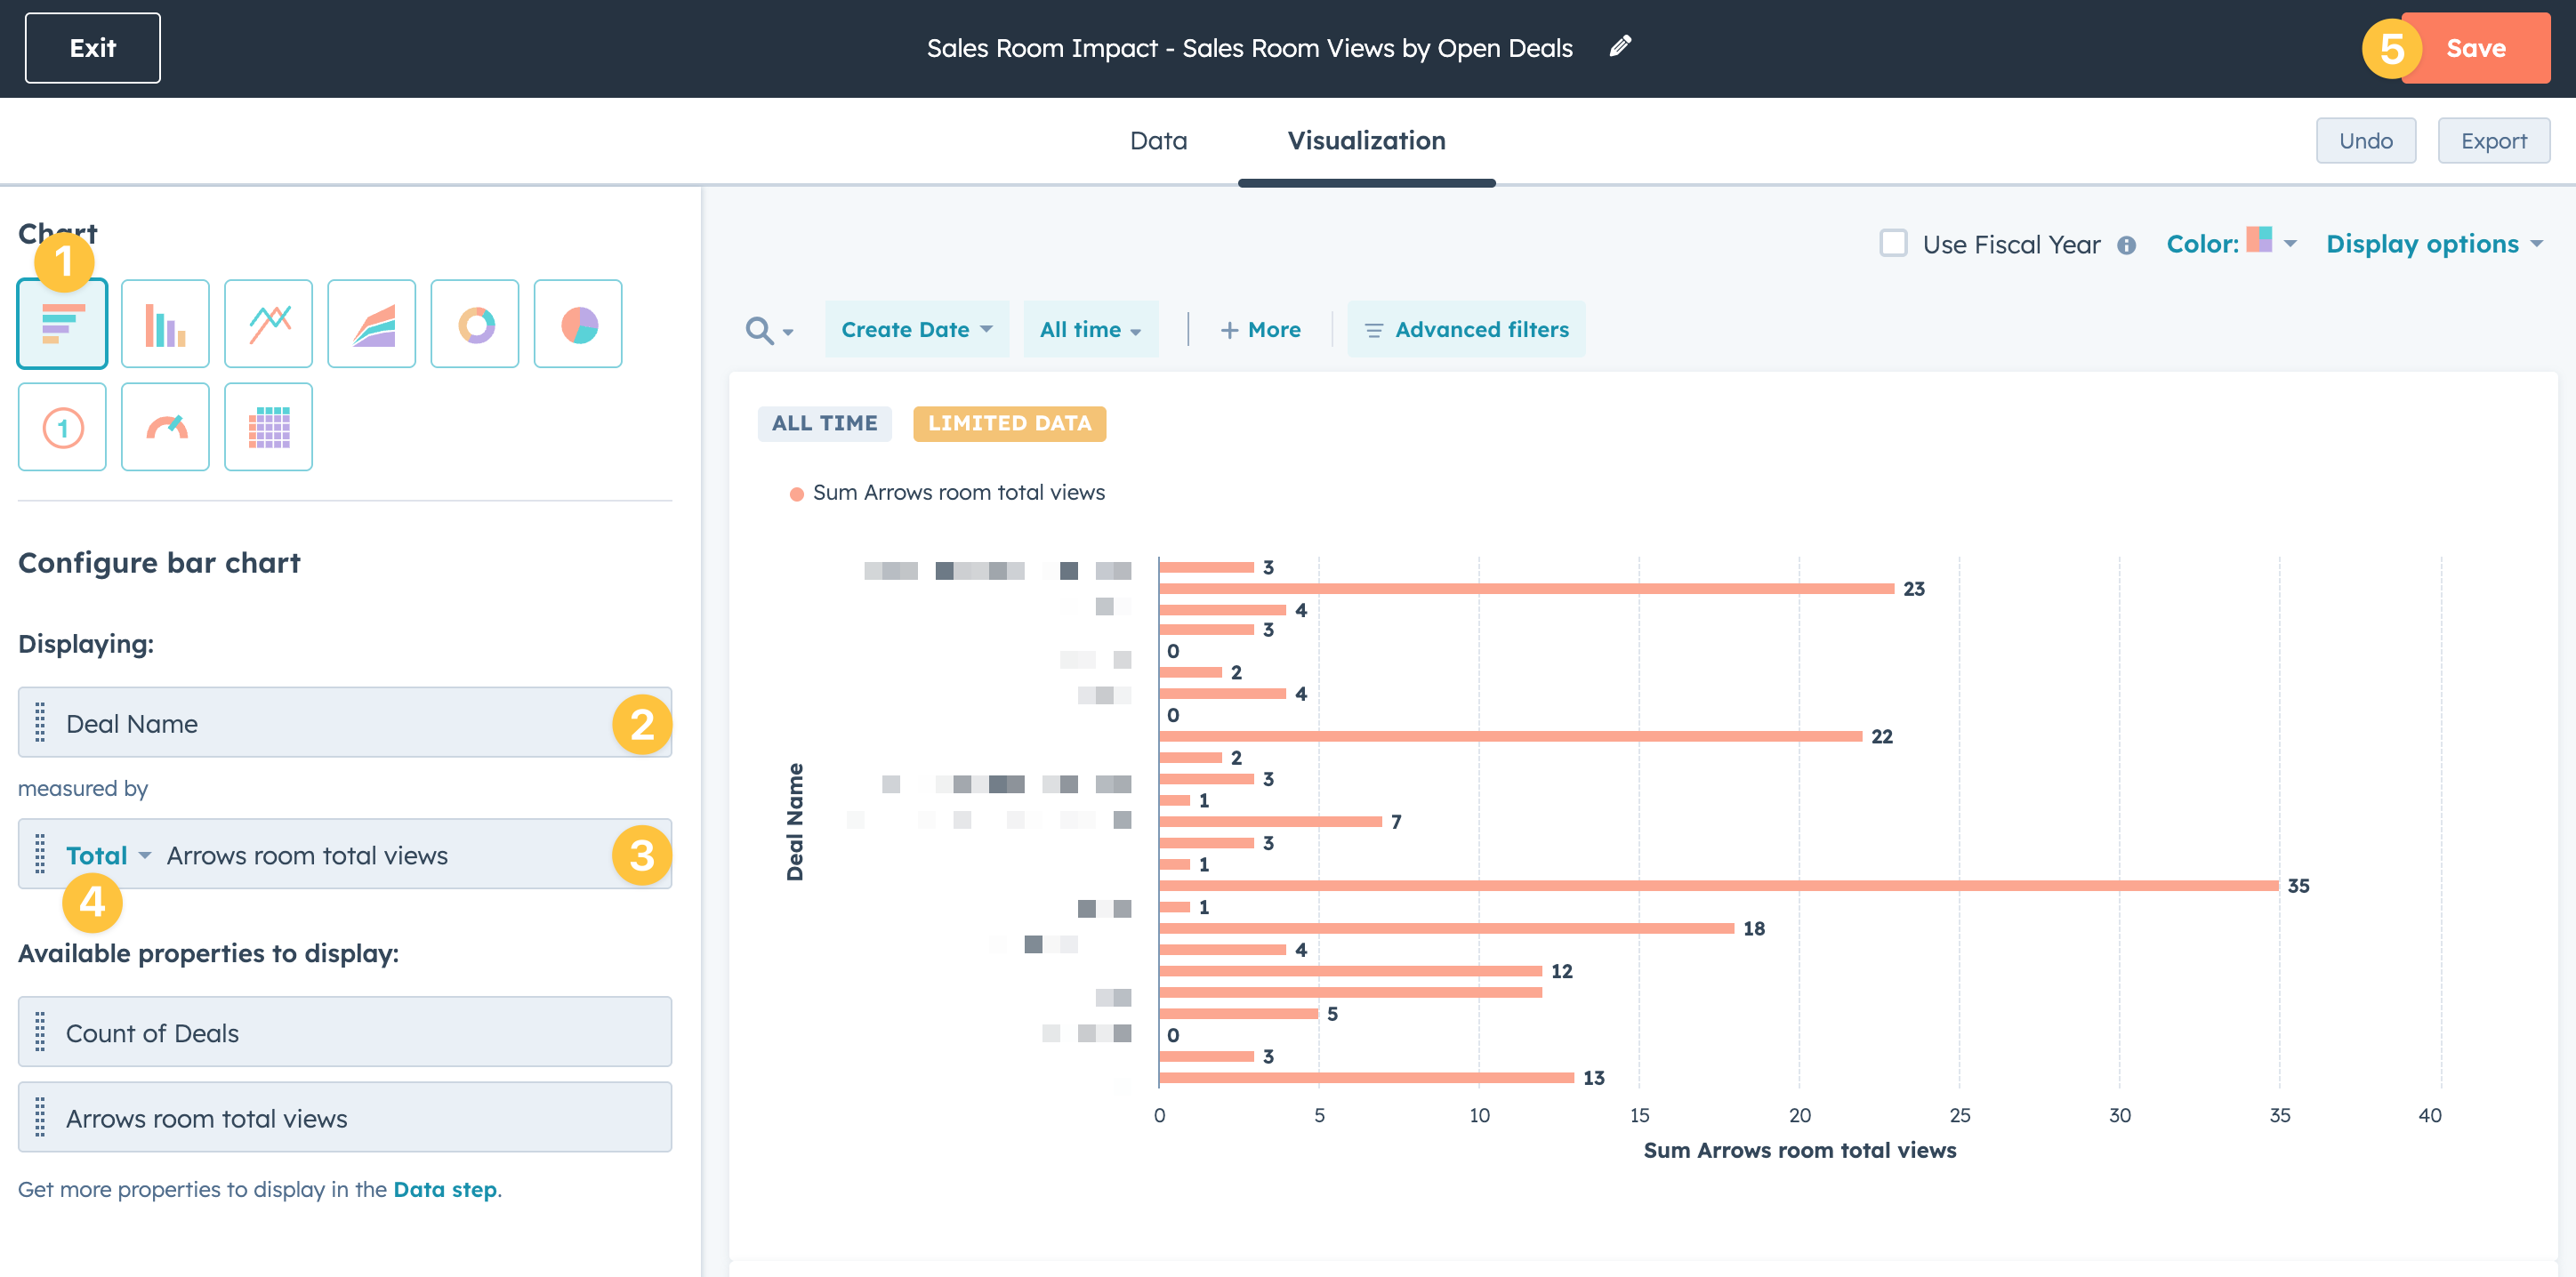
From the Visualization tab…
Select the Horizontal graph chart type
Add Deal Name as the displaying property
Add Arrows room total views as the measured by property
Change the measured by type to Total
Save your report and add it to your dashboard
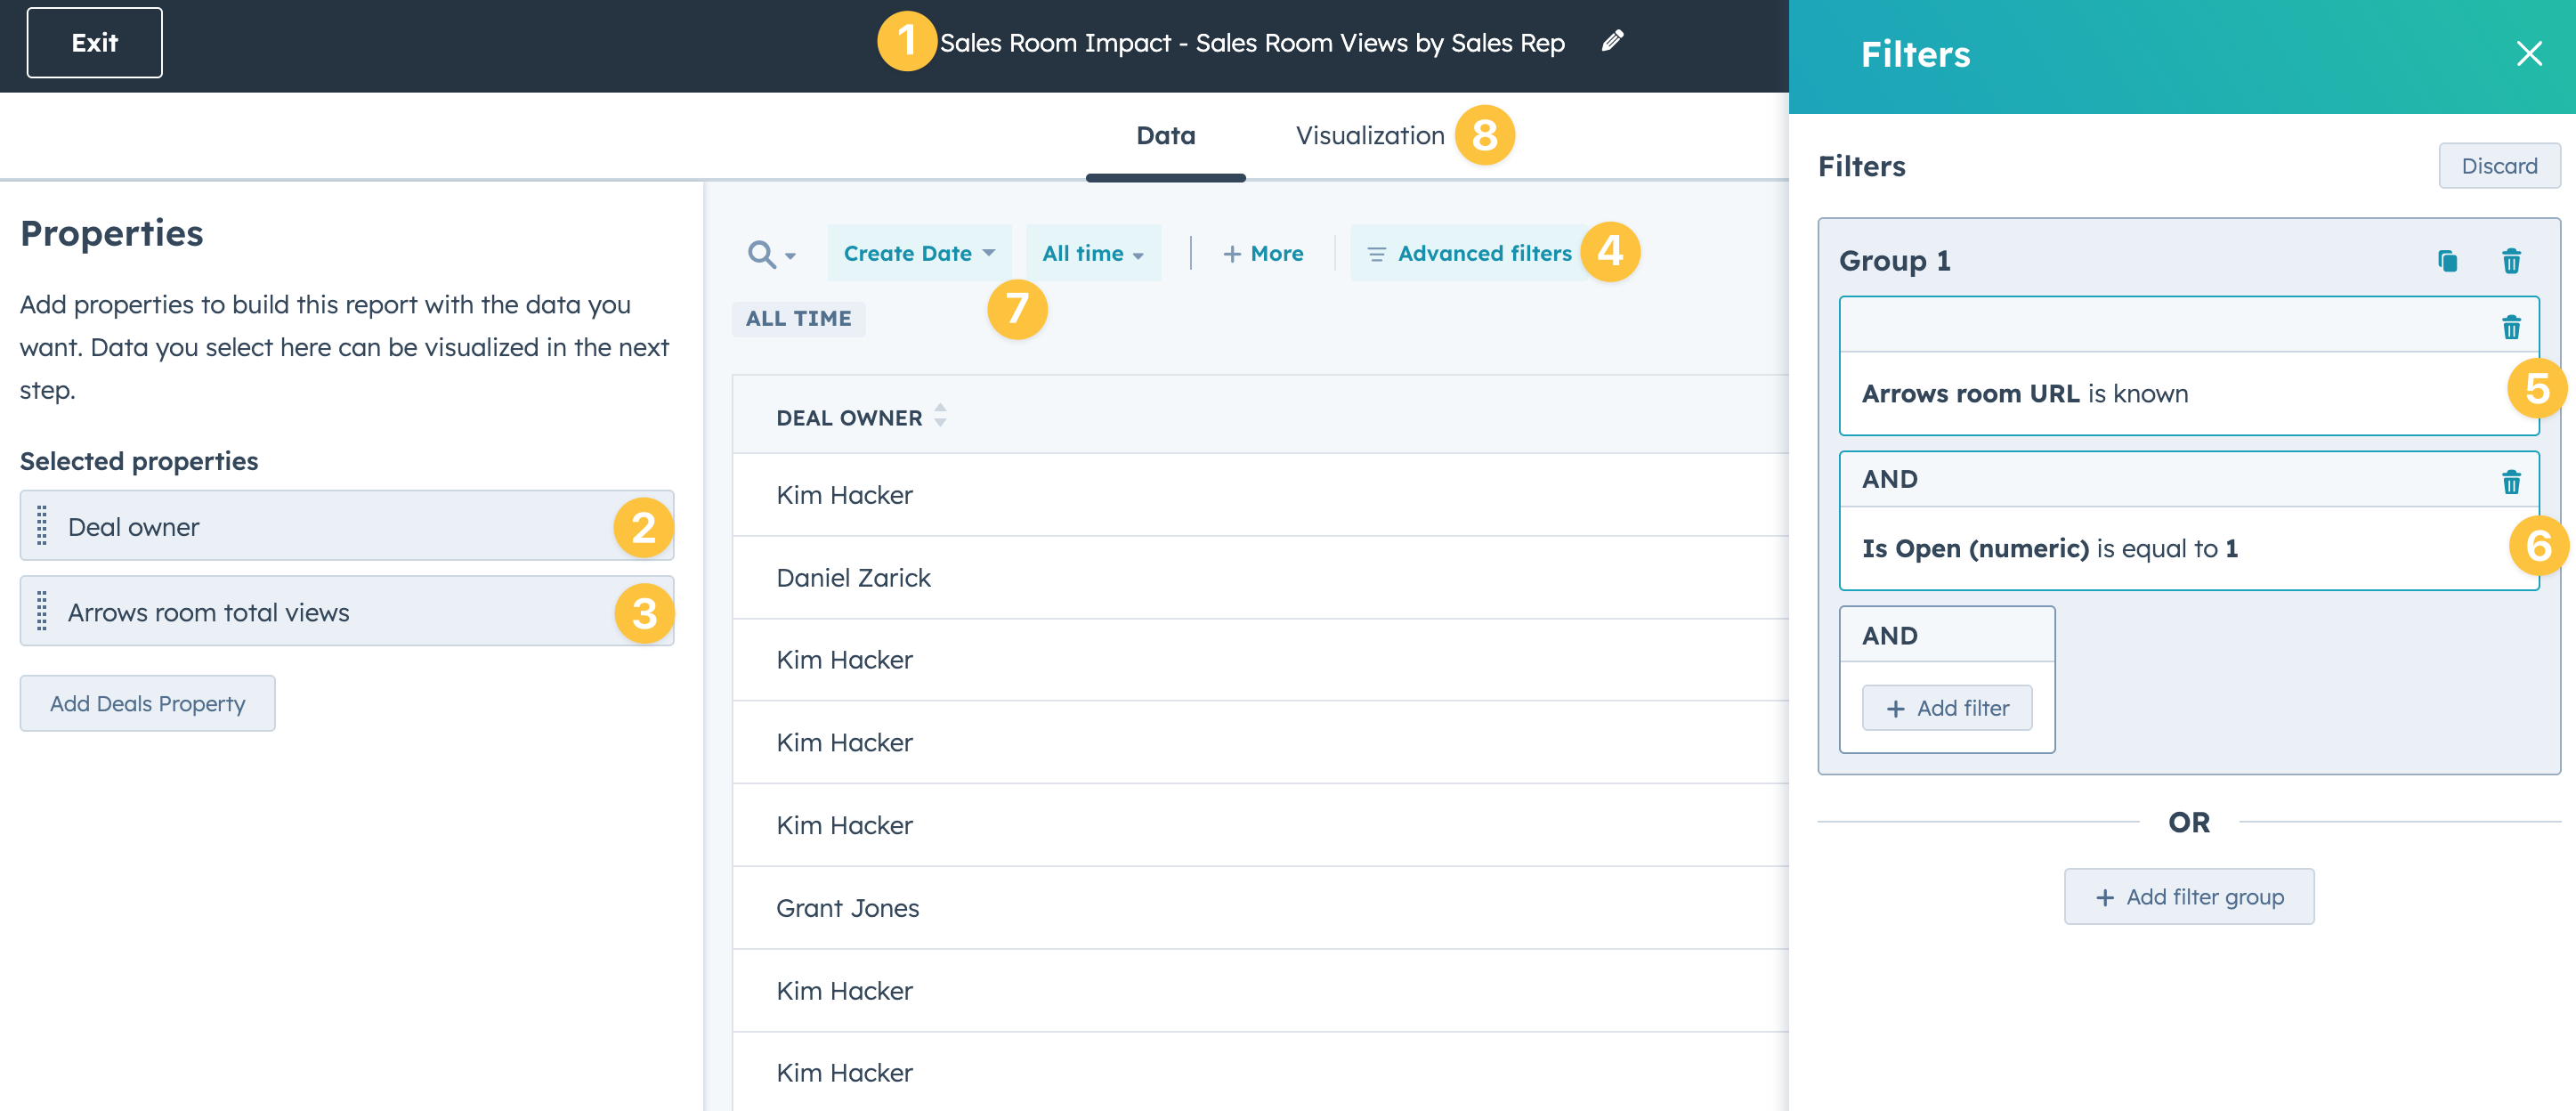
Report 5 - Sales room views by sales rep
This report will help you understand the total views each room has based on sales rep for deals with an attached Arrows room.
After you create the report, start by…
naming your report
Add Deal owner as a property
Add Arrows room total views as a property
Select advanced filters
Add a filter for Arrows room URL is known
Add a filter for Is Open is equal to “1”
Adjust your time range
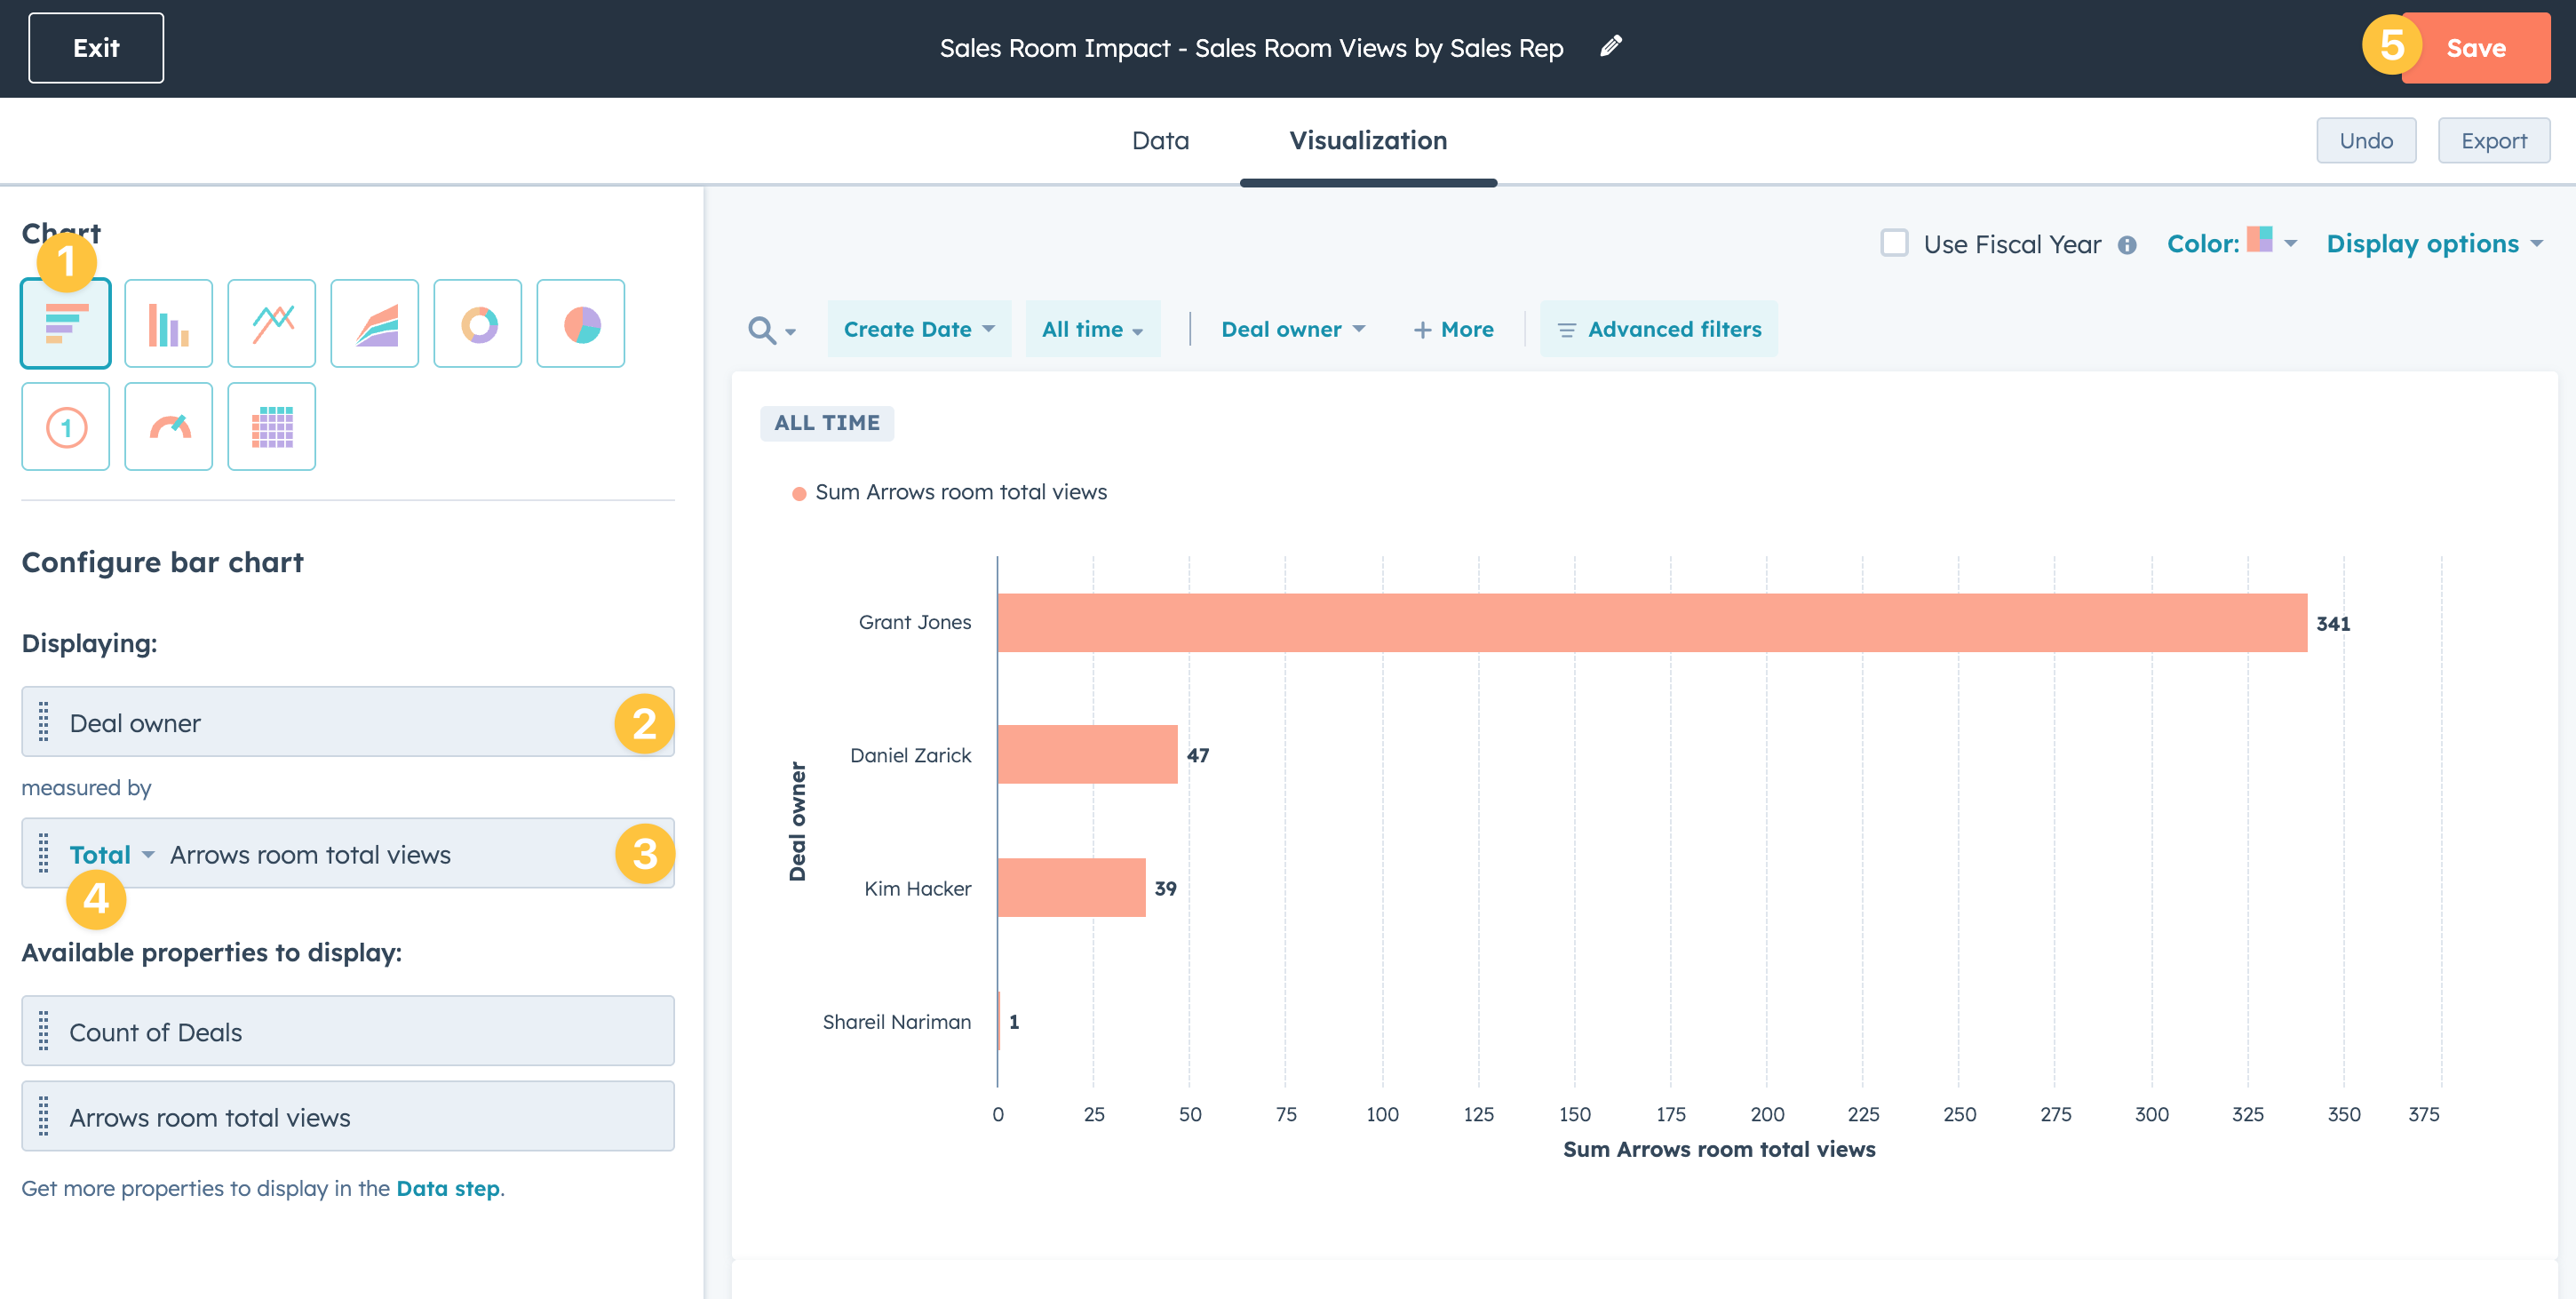
Select Visualization to continue setup
From the Visualization tab…
Select the Horizontal graph chart type
Add Deal owner as the displaying property
Add Arrows room total views as the measured by property
Change the measured by type to Total
Save your report and add it to your dashboard
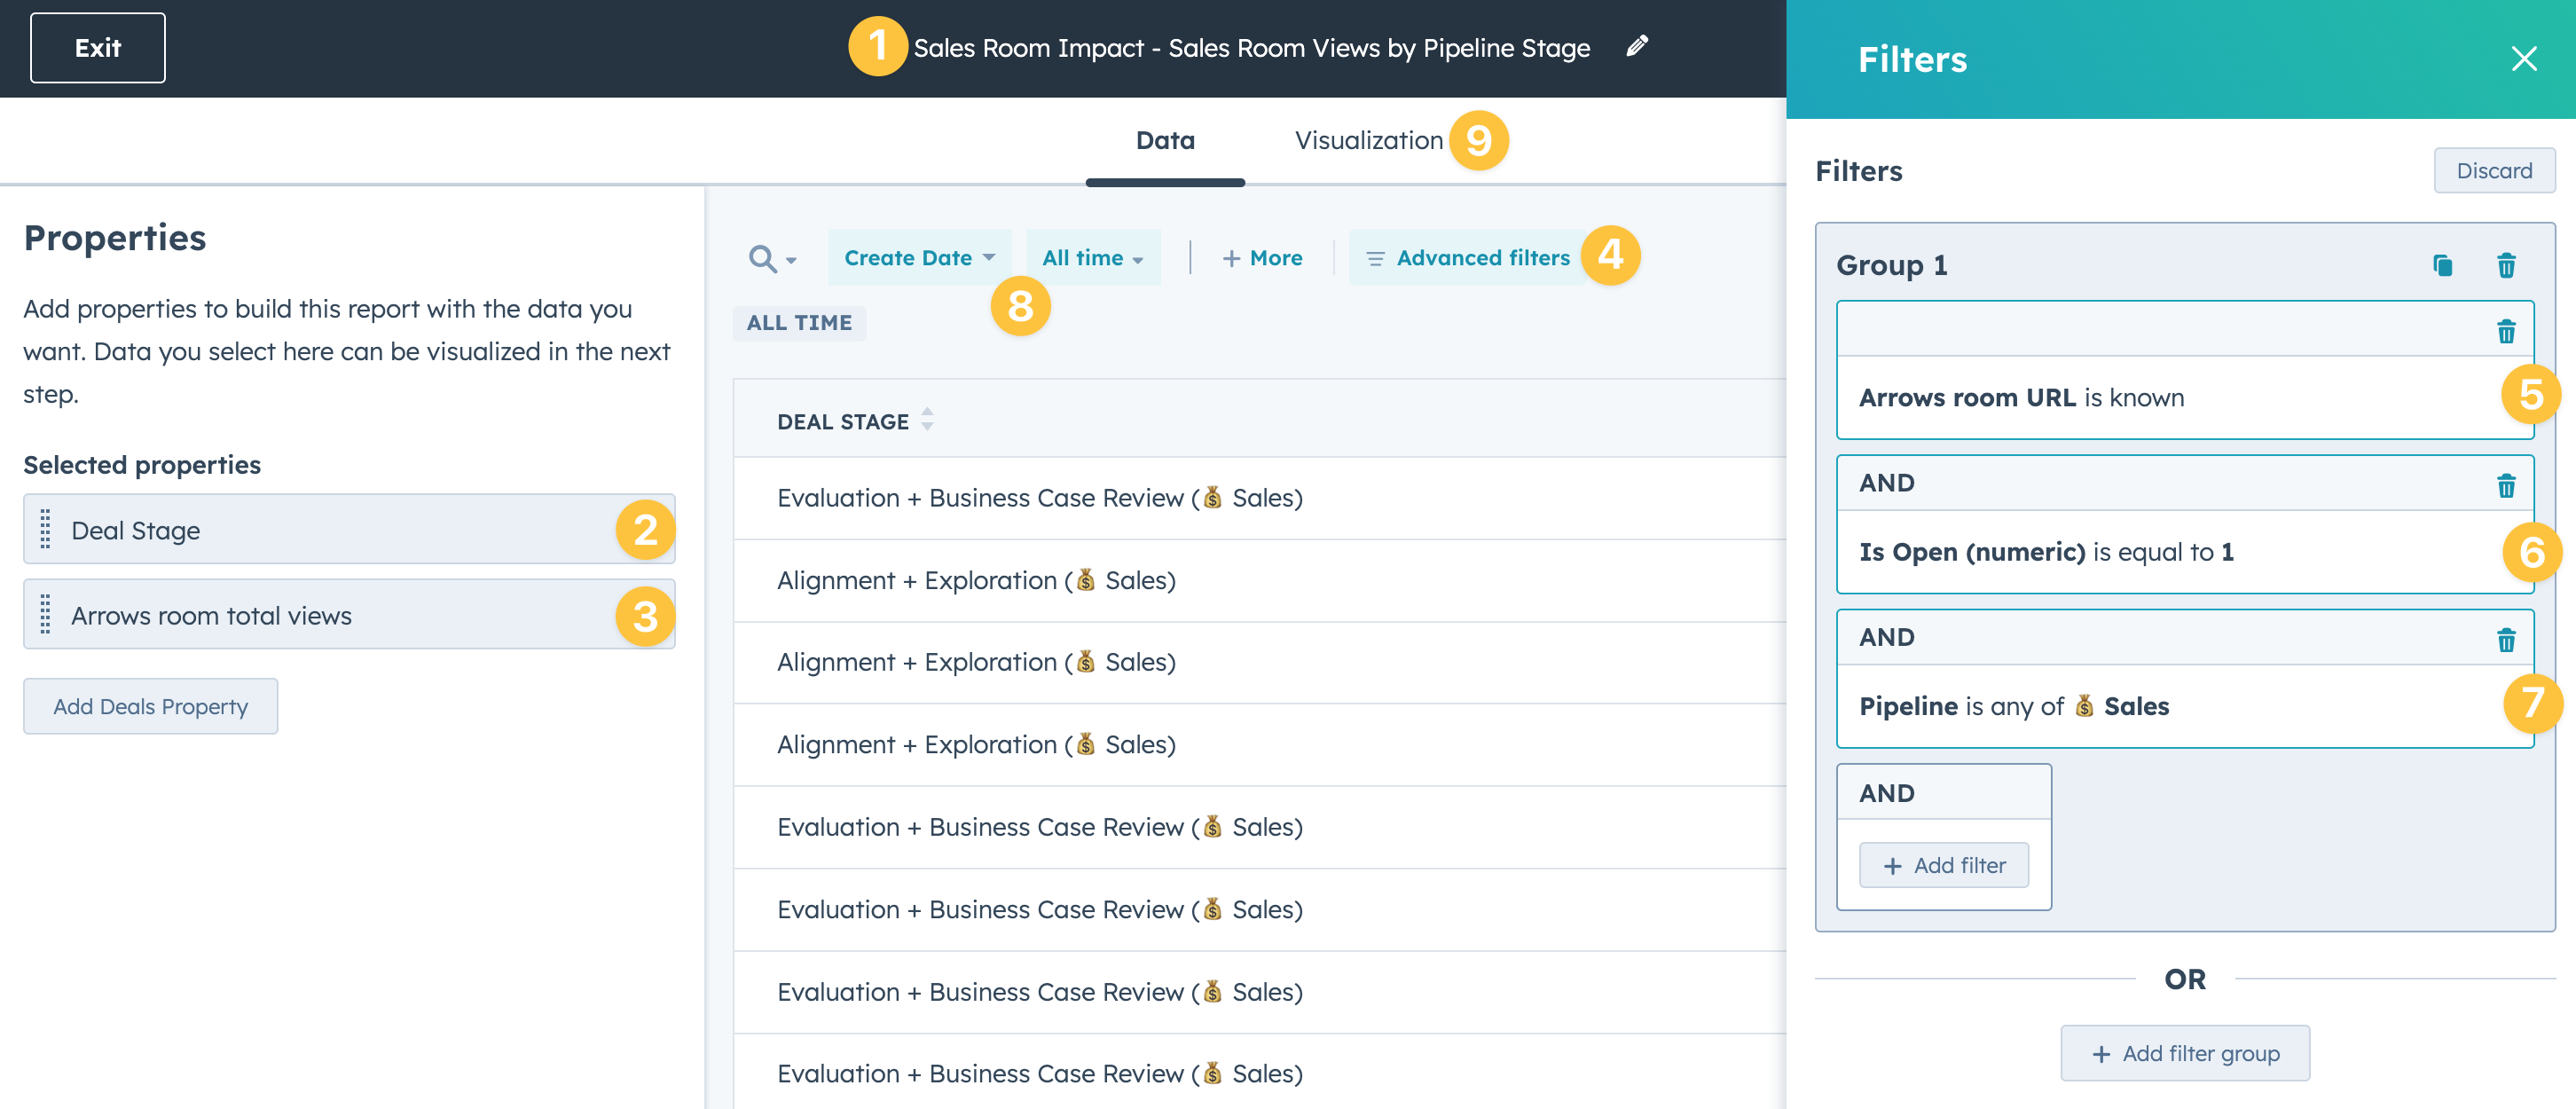
Report 6 - Sales rooms views by pipeline stage
This report will help you understand the total room views based on pipeline stage for deals with an attached Arrows room.
After you create the report, start by…
naming your report
Add Deal Stage as a property
Add Arrows room total views as a property
Select advanced filters
Add a filter for Arrows room URL is known
Add a filter for Is Open is equal to “1”
Add a filter for Pipeline to filter down to just your sales pipeline
Adjust your time range
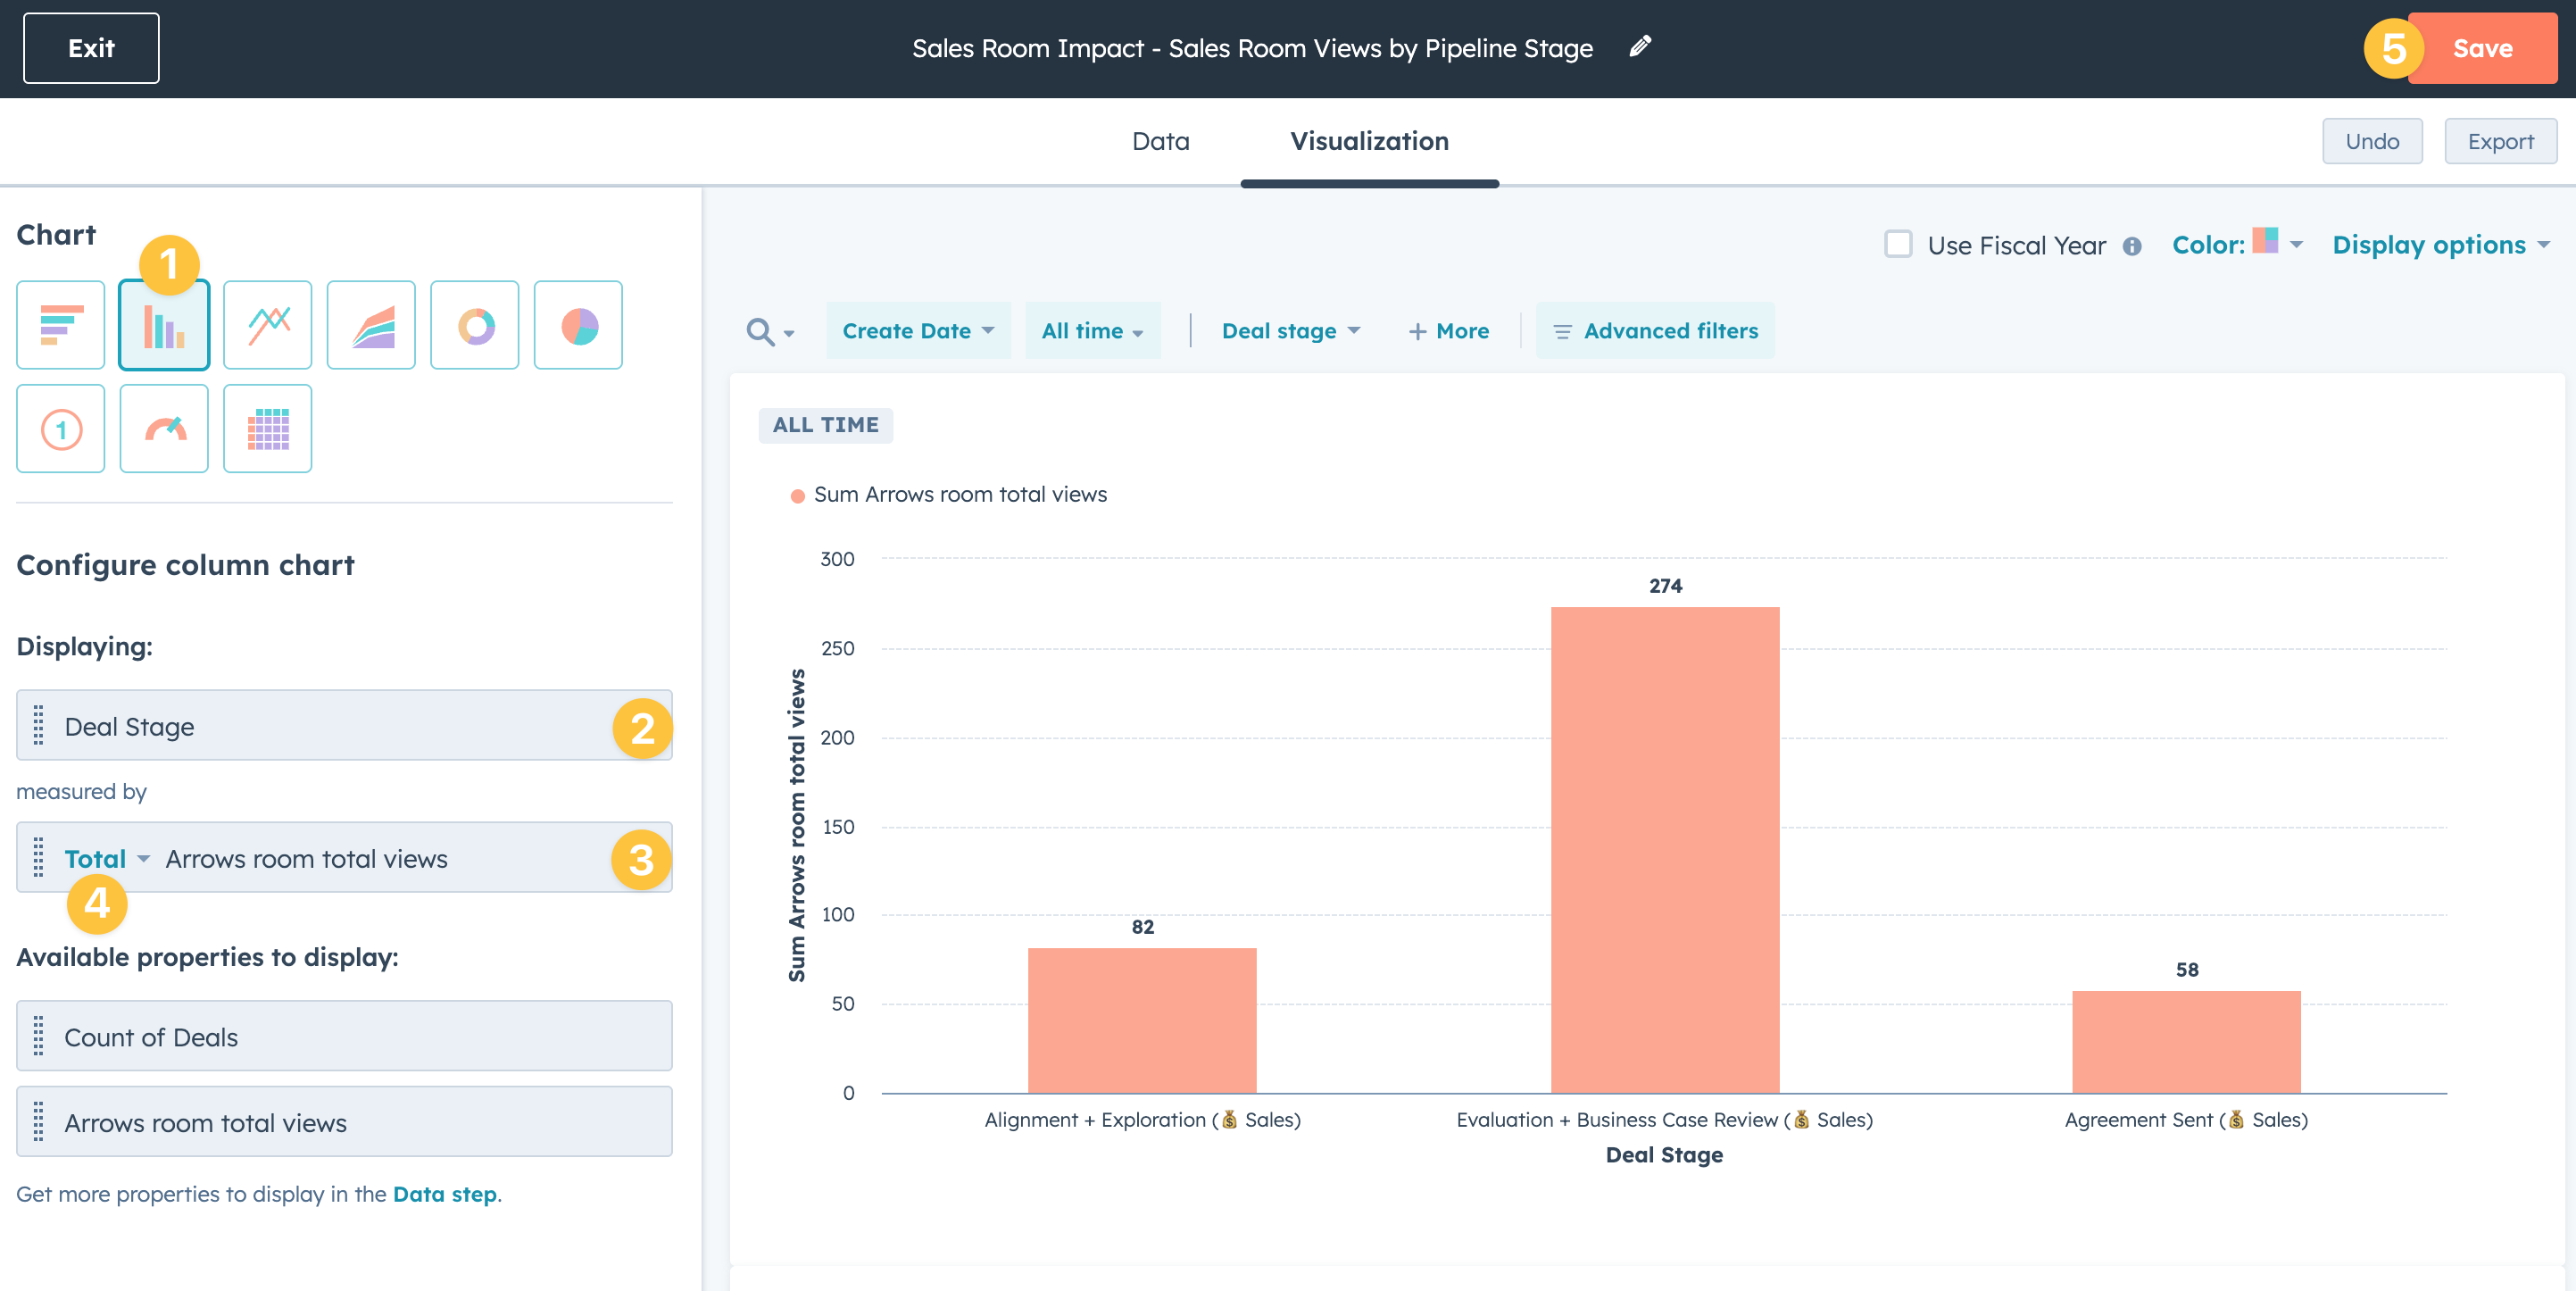
Select Visualization to continue setup
From the Visualization tab…
Select the Vertical graph chart type
Add Deal Stage as the displaying property
Add Arrows room total views as the measured by property
Change the measured by type to Total
Save your report and add it to your dashboard
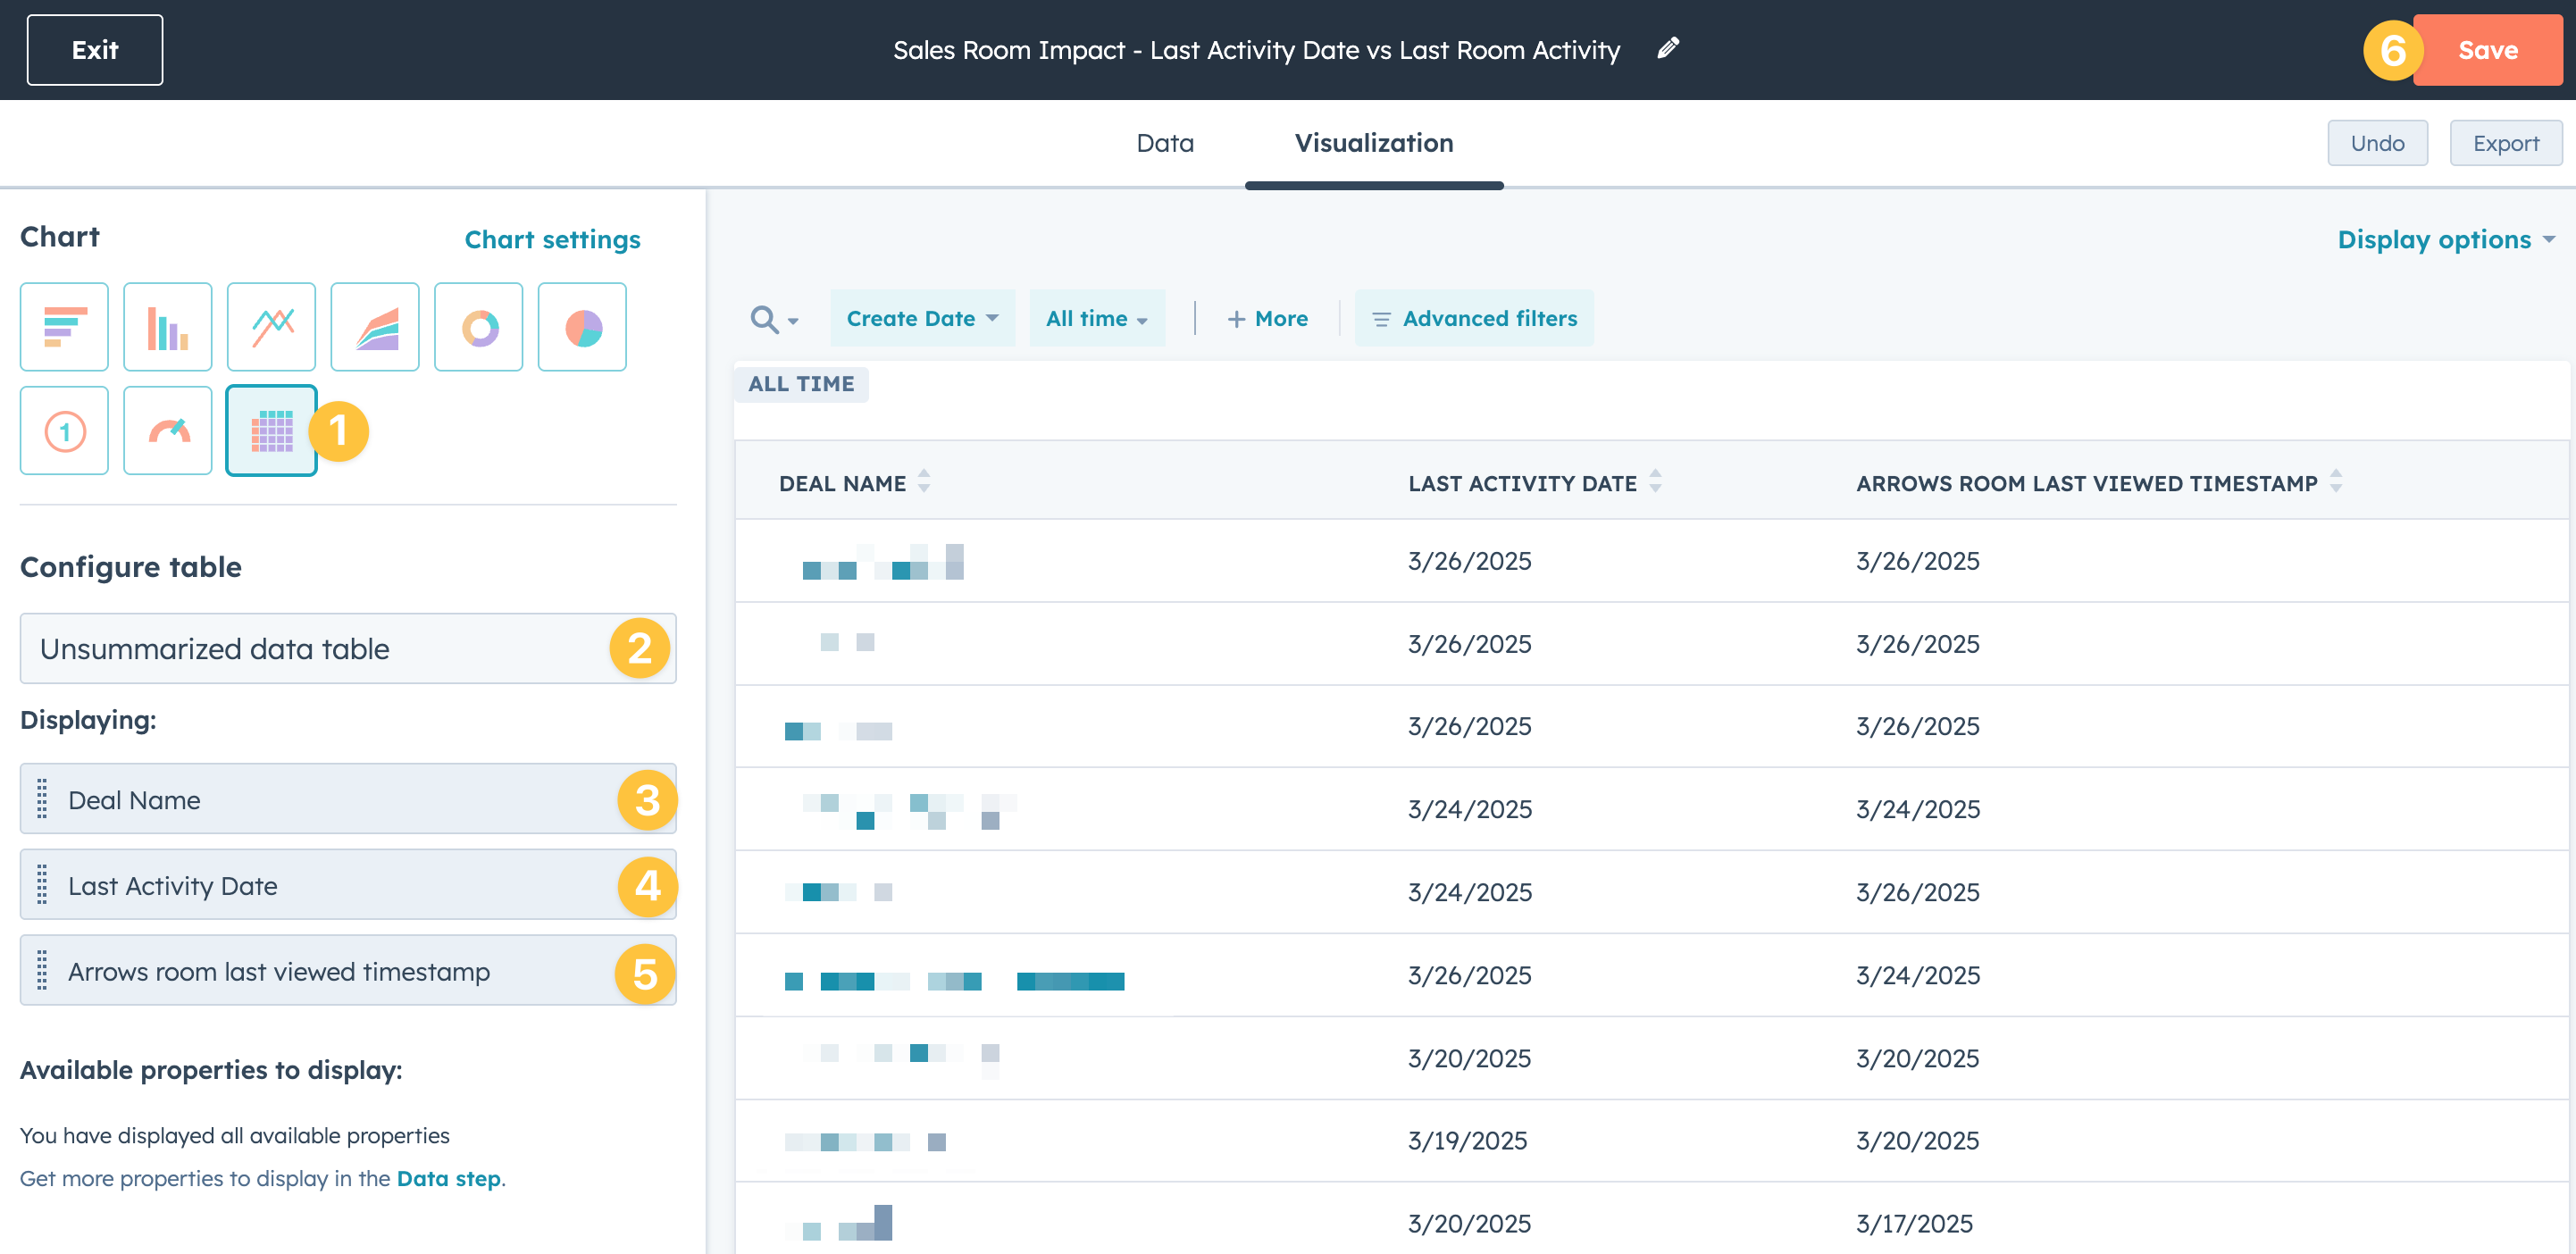
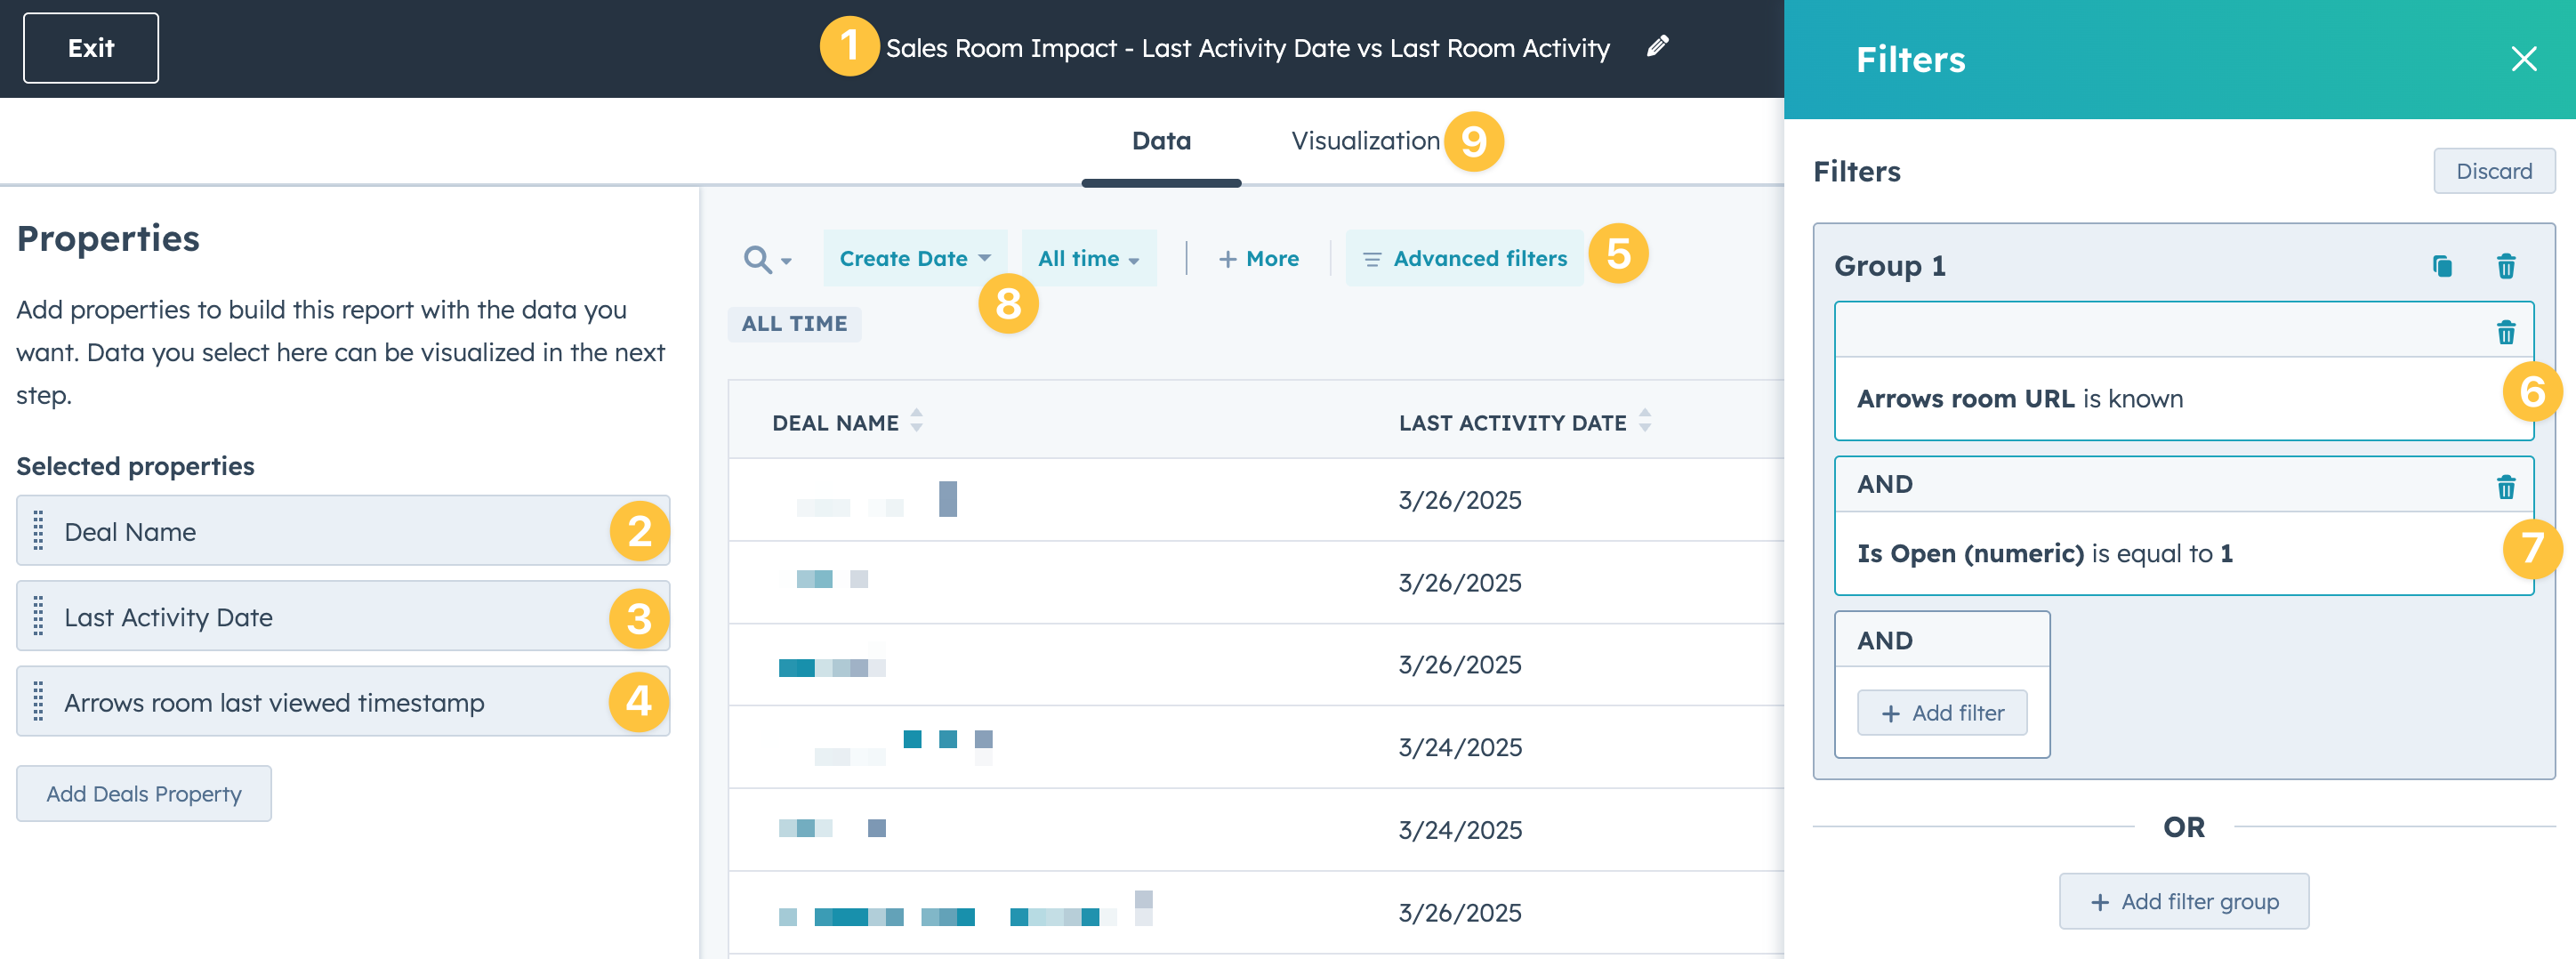
Report 7 - Last activity date vs last room activity
This report will help you compare the last time there was a recorded HubSpot activity (meeting, call, etc.) compared to the last time the sales room itself had a view for deals with an attached Arrows room.
After you create the report, start by…
naming your report
Add Deal name as a property
Add Last Activity Date as a property
Add Arrows room last viewed timestamp as a property
Select advanced filters
Add a filter for Arrows room URL is known
Add a filter for Is Open is equal to “1”
Adjust your time range
Select Visualization to continue setup
From the Visualization tab…
Select the Table chart type
Configure the table to be an Unsummarized data table
Add Deal Name as a displaying property
Add Last Activity Date as a displaying property
Add Arrows room last viewed timestamp as a displaying property
Save your report and add it to your dashboard